Viewing Dashboards
The DocumentDB for Foglight cartridge provides the following top-level views: DocumentDB Clusters, Elastic Cluster, and Instance-Based Cluster.
The views Cluster/Overview, Resource Utilization, Operations Statistics, Throughput, and System are available at the cluster level as well as at the instance level. Use the instance selector in the top left of each dashboard to scope the current view to the selected cluster or instance. To navigate to a different instance from the legacy dashboards, first select Cluster, to return to the new cluster-level dashboard, then use the instance selector as above.
For instance-based clusters, the following views are available at the instance level: Overview, Databases, Collections, Resource Utilization, Operations Statistics, Throughput, and System.
This cartridge includes the following main dashboards:
- DocumentDB Clusters
- Elastic Cluster
- Instance-Based Cluster
- Instance Overview
- Databases
- Collections
- Collection Statistics
- Resource Utilization
- Operations
- Throughput
- System
DocumentDB Clusters
The top level DocumentDB Clusters dashboard lists all instance-based clusters and elastic clusters monitored by Foglight. In the case of global clusters, the primary cluster and any secondary clusters are listed separately, with the common global cluster identifier in the Global Cluster column, which otherwise remains blank. This table provides a quick view of the most important metrics: Health, Workload, and Availability. For instance-based clusters, the Engine Version is given as well.

Elastic Cluster
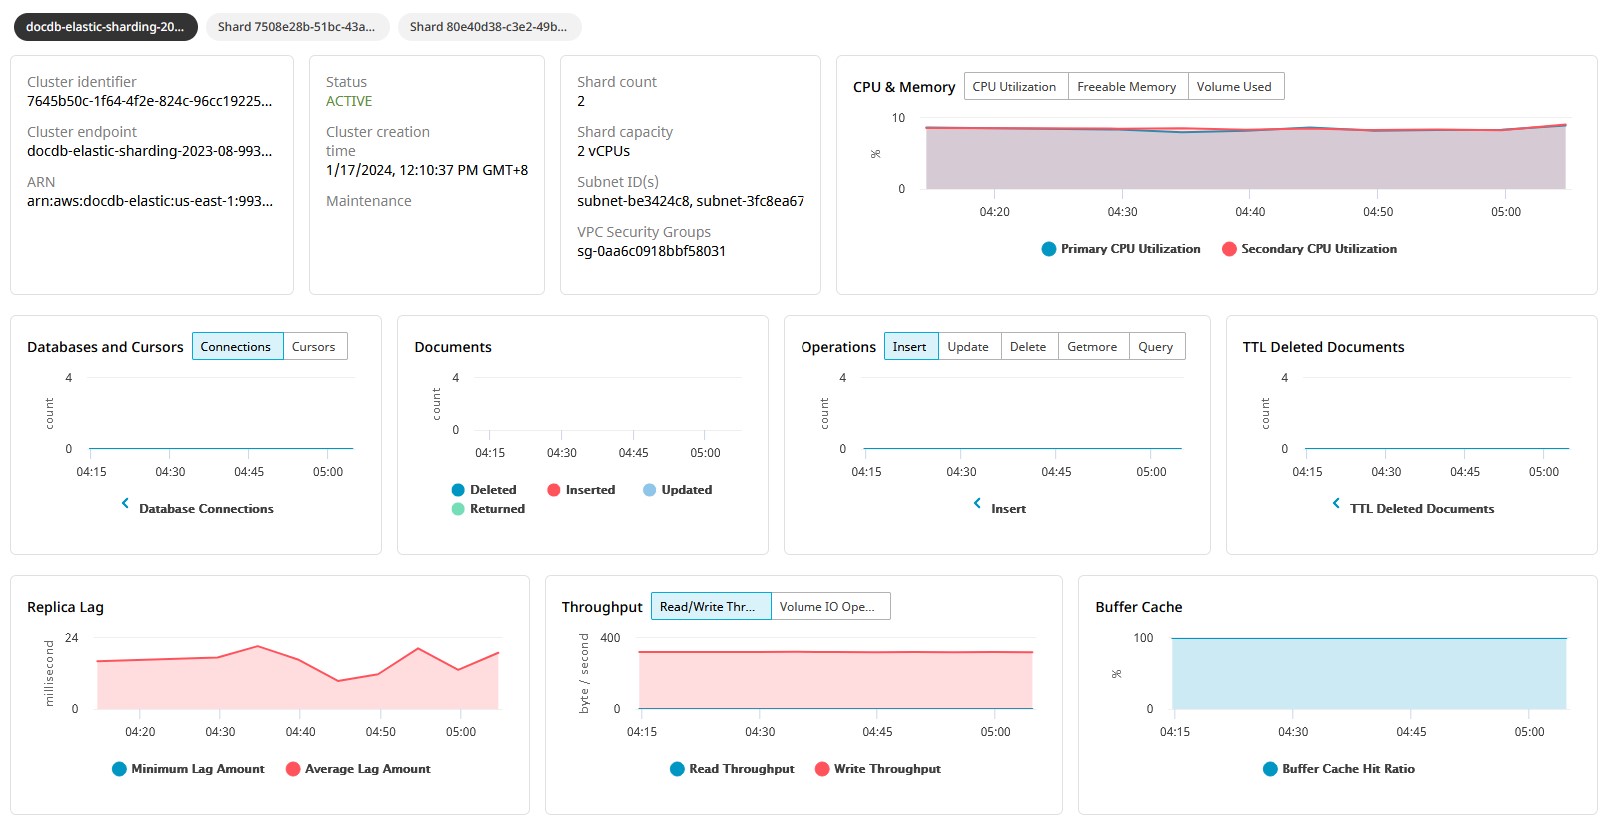
The first of two types of DocumentDB clusters, the Elastic Cluster dashboard provides configuration and metric details on an individual cluster and on each of its shards. Selecting a chip in the top row updates all charts in the view to show metrics relevant to the respective shard, or to the entire cluster (the default).
Instance-Based Cluster
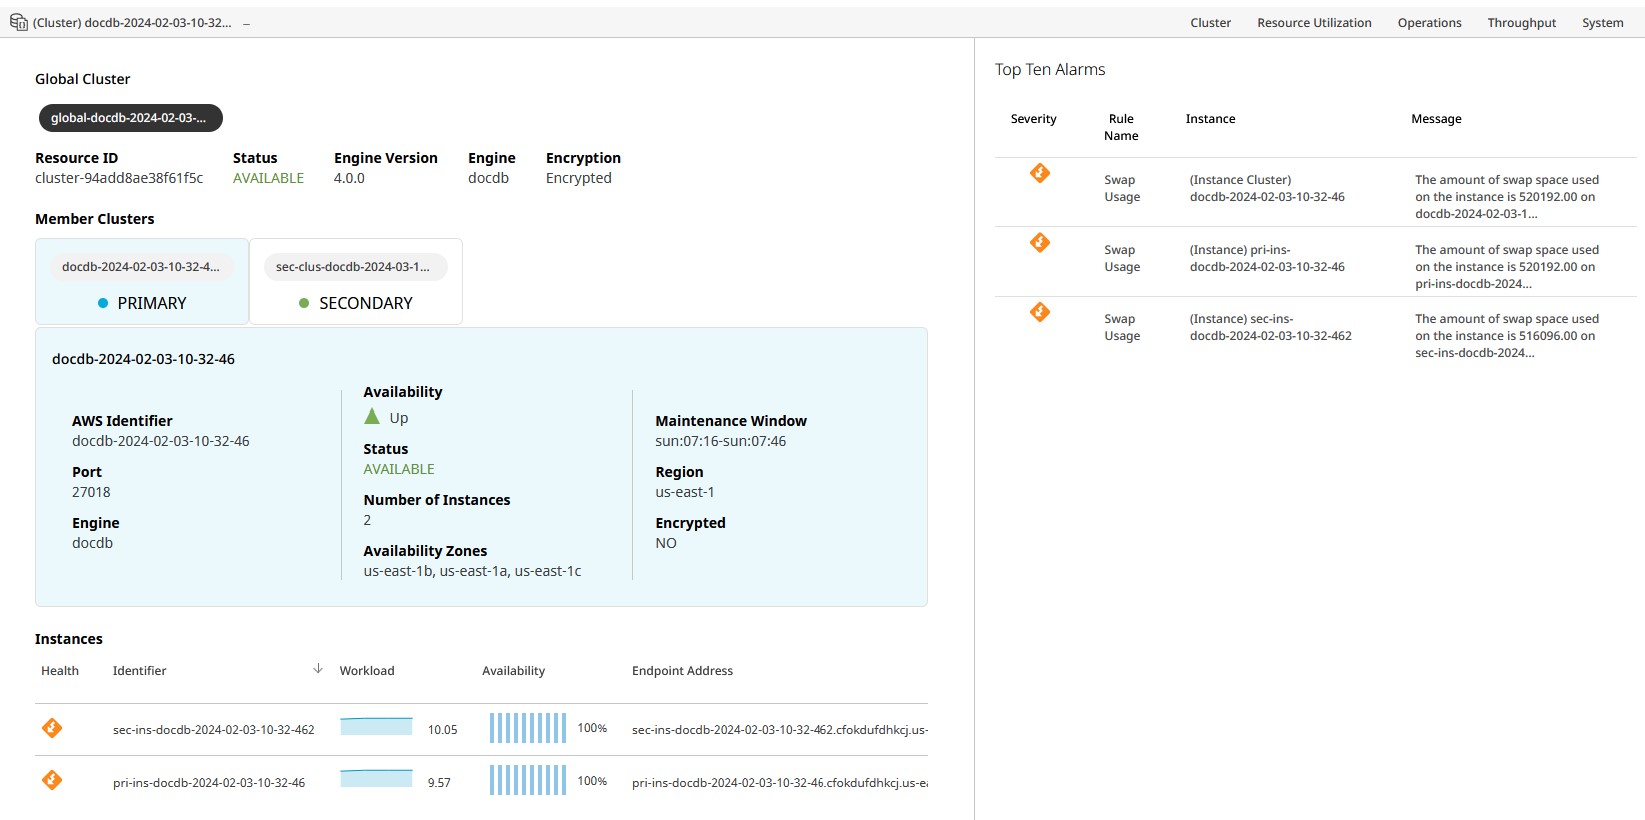
The second DocumentDB cluster type, the Instance-Based Cluster has a dedicated overview dashboard as well. In the case of a global cluster, its configuration is visible at the top of the screen. This is followed by member cluster/regional cluster configuration and availability for each member. At the bottom on the left side, a listing of instances and their most important vital stats follows. On the right panel, the most urgent alarms are provided, with details including: alarm severity, affected instance, and message.
Instance Overview
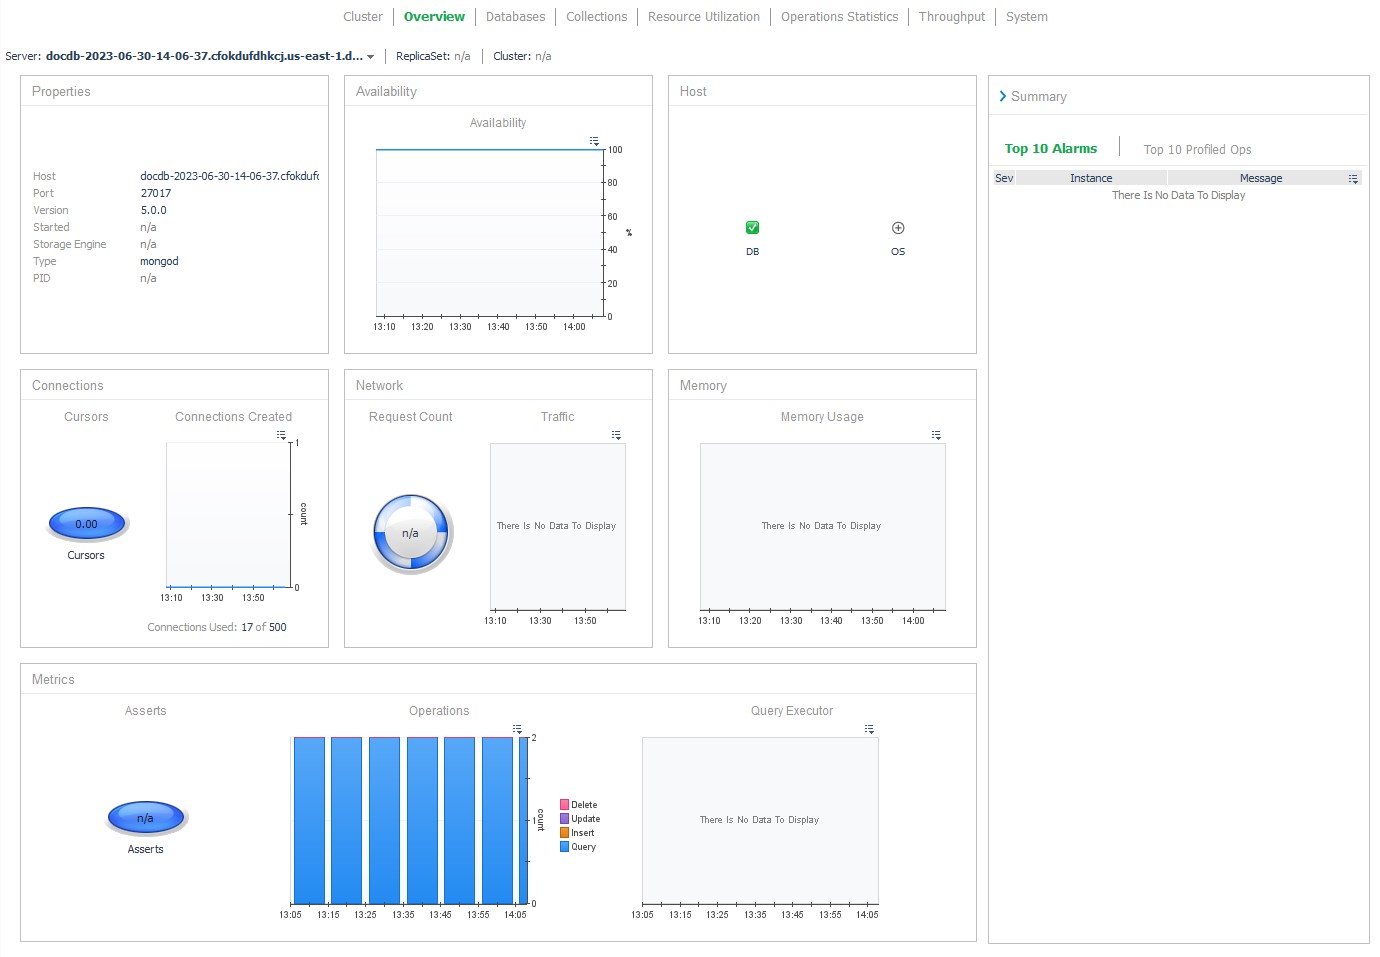
The legacy MongoDB instance overview dashboard is available for instances of instance-based clusters. Several metrics that are not provided by the DocumentDB API will show as “n/a” or “There Is No Data To Display”.
Databases
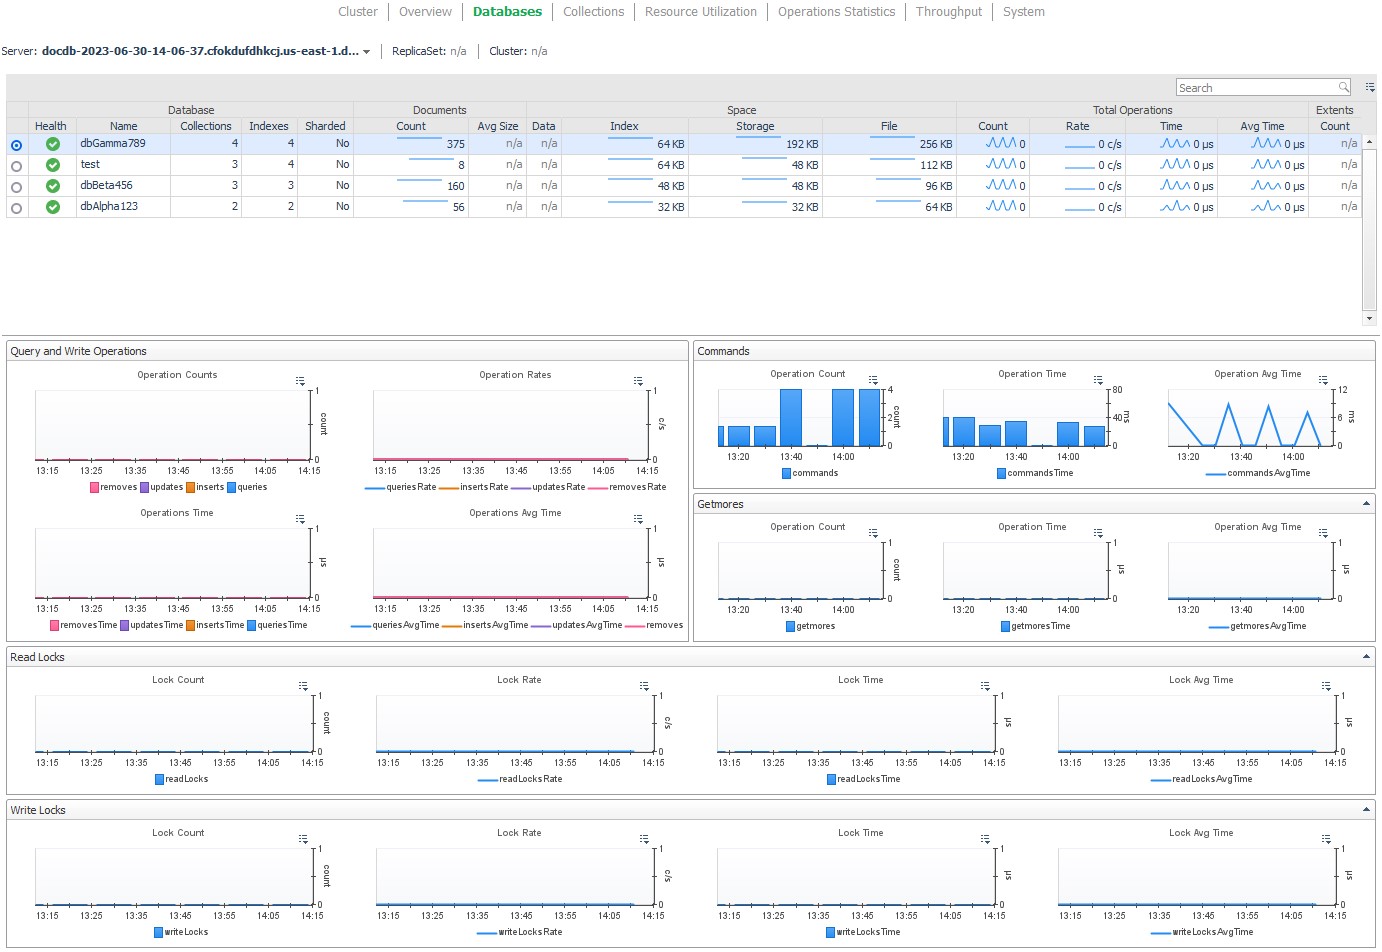
The Databases dashboard lists all non-system databases on the server, along with a variety of usage and performance information. Selecting a row updates the lower section to show operation statistics for that database. Clicking a value in the Collections column drills down to the Collections page for this server, with only the collections for the selected database row shown.
Collections
The Collections dashboard lists the largest non-system collections on the server up to the configured maximum collection count. Identifying information, size, and capped collection configuration are displayed for each. Only collections for the selected databases are shown. The Select Databases option at the top-left of the table provides the option to change which database(s) are selected. Clicking on a collection name drills down to the Collection Statistics page, discussed below.

Collection Statistics
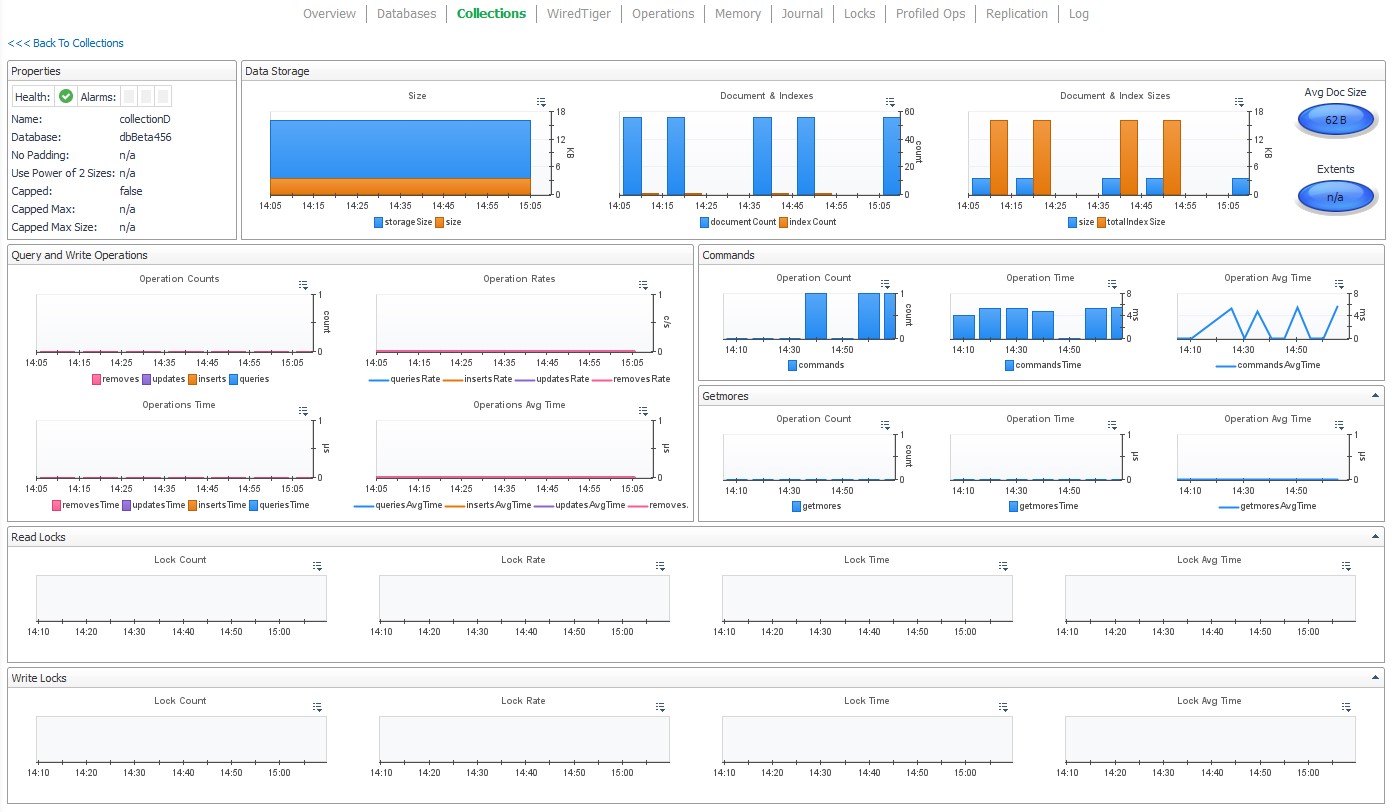
The Collection Statistics page shows all information available for a single collection. This includes configurations properties, data storage, and operational metrics.
Resource Utilization
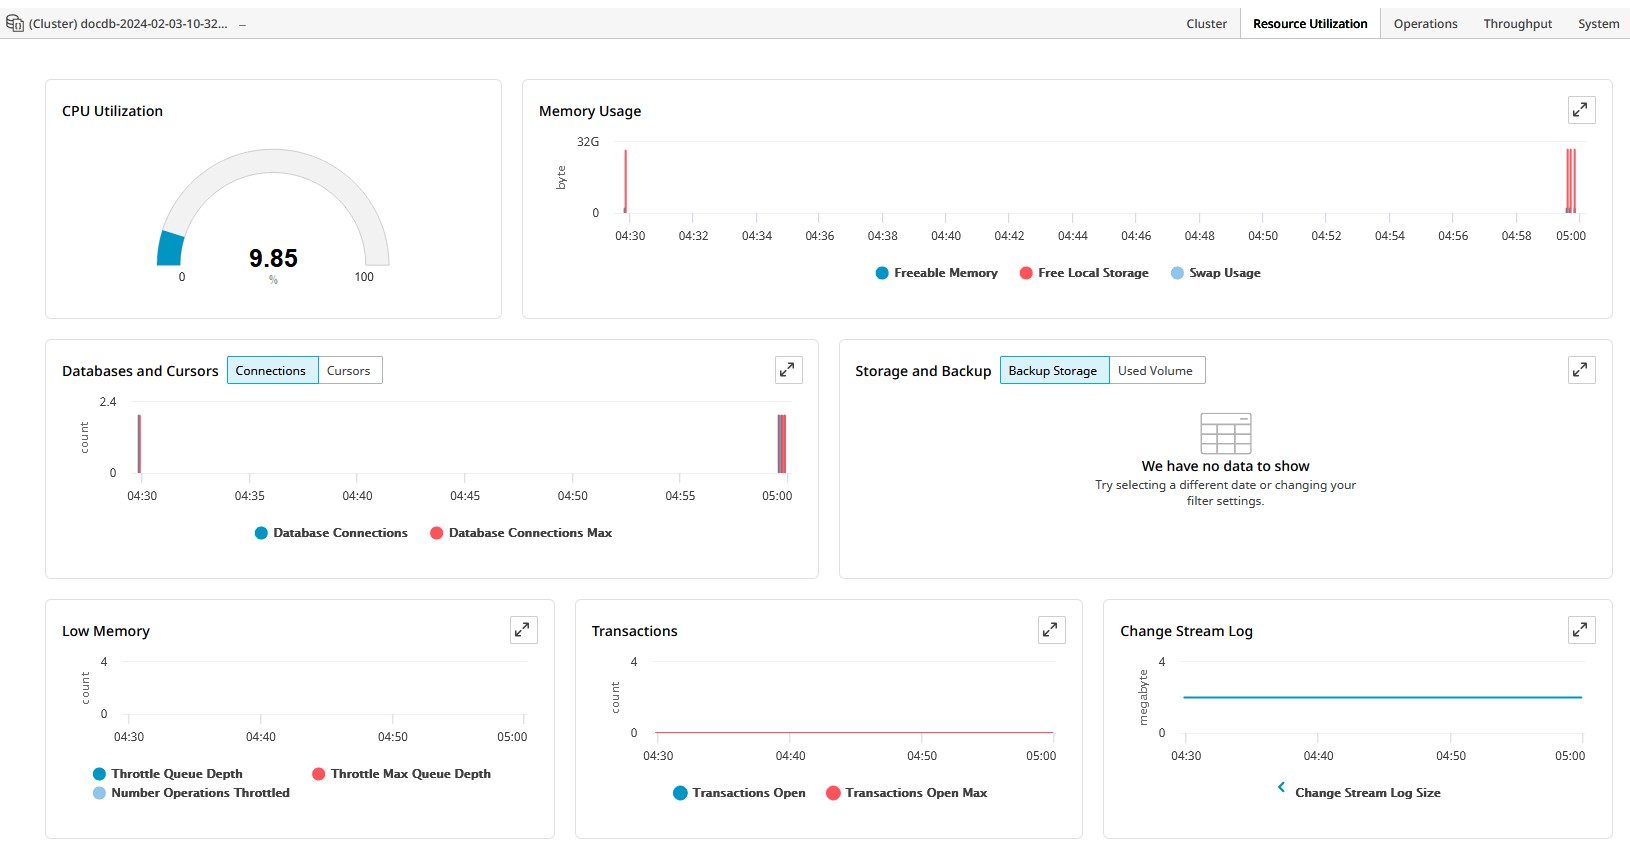
The Resource Utilization dashboard, at either the cluster or instance level, displays CPU, memory, and storage metrics.
Operations
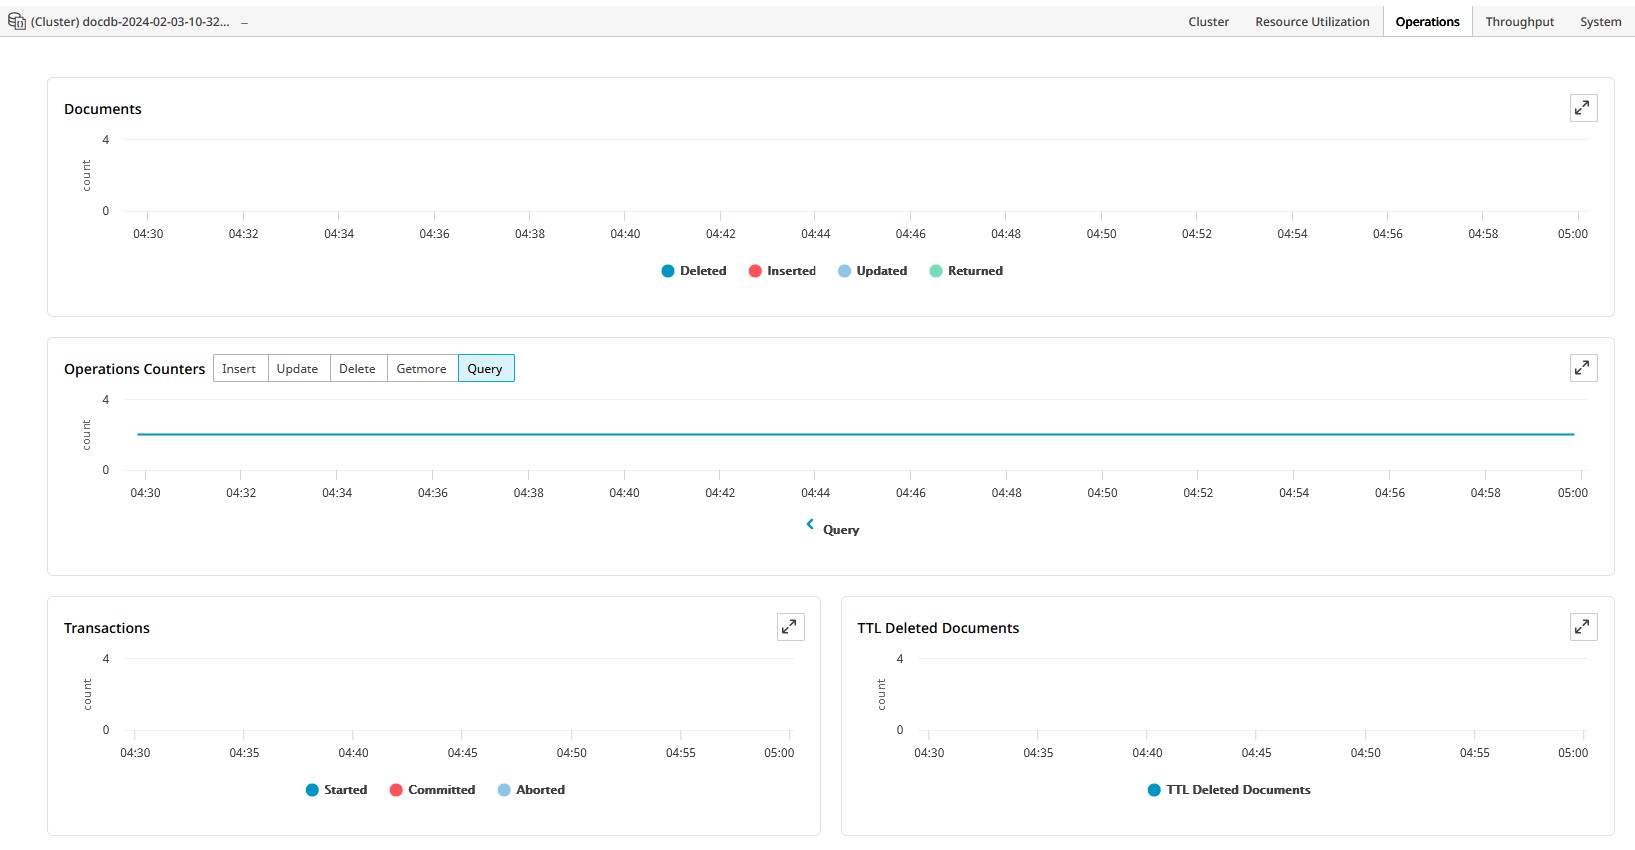
The Operations dashboard, at either the cluster or instance level, displays document, operation, and transaction metrics.
Throughput
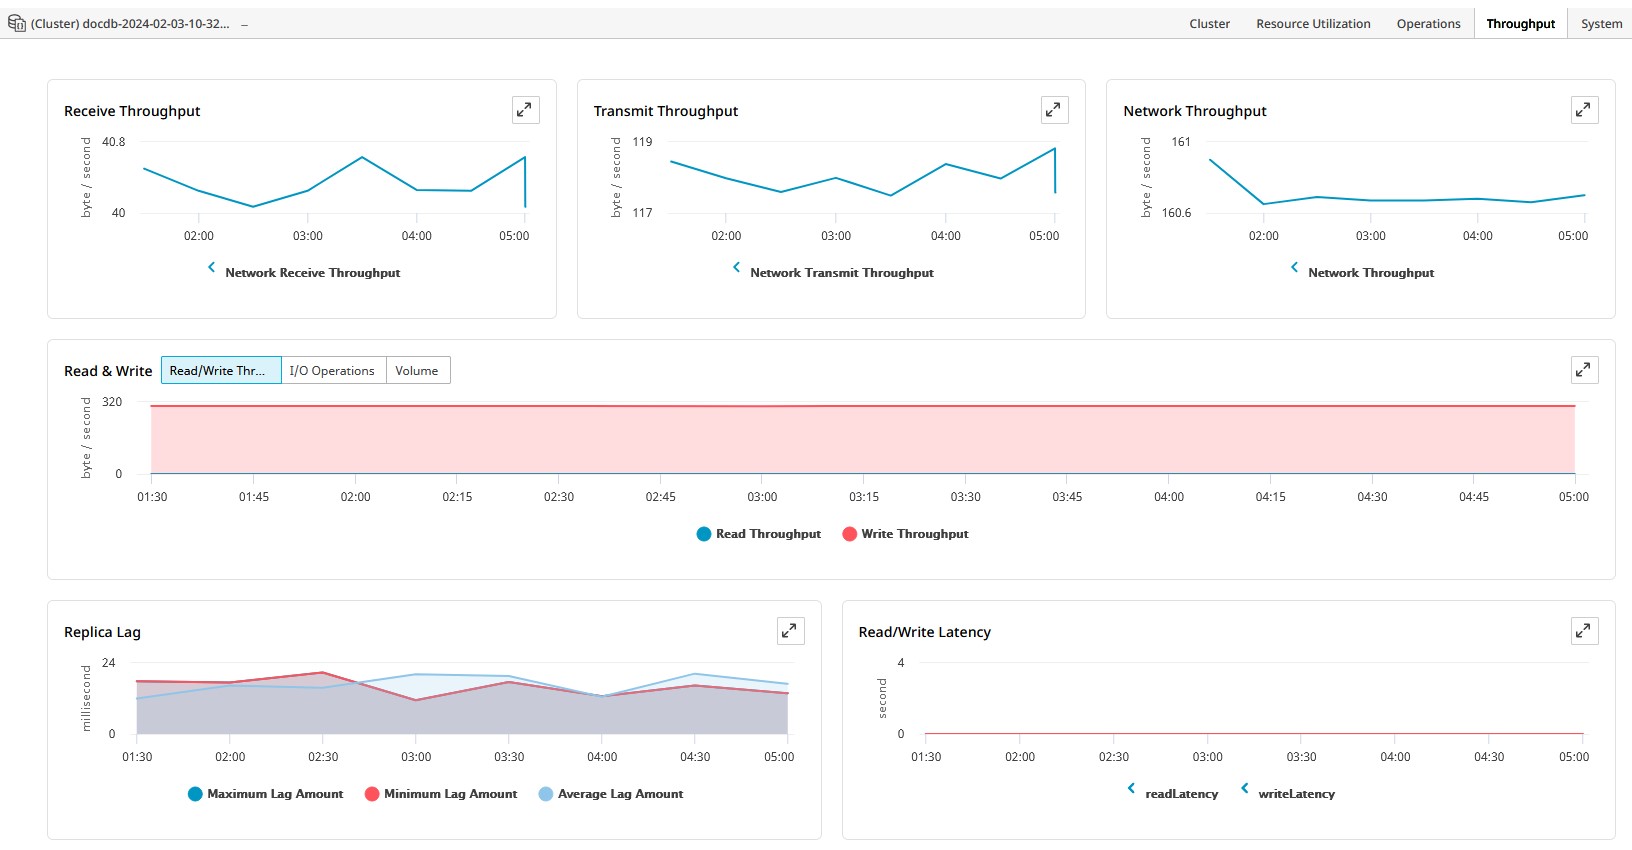
The Throughput dashboard, at either the cluster or instance level, displays network metrics, read and write operations, replication lag, and latency times.
System
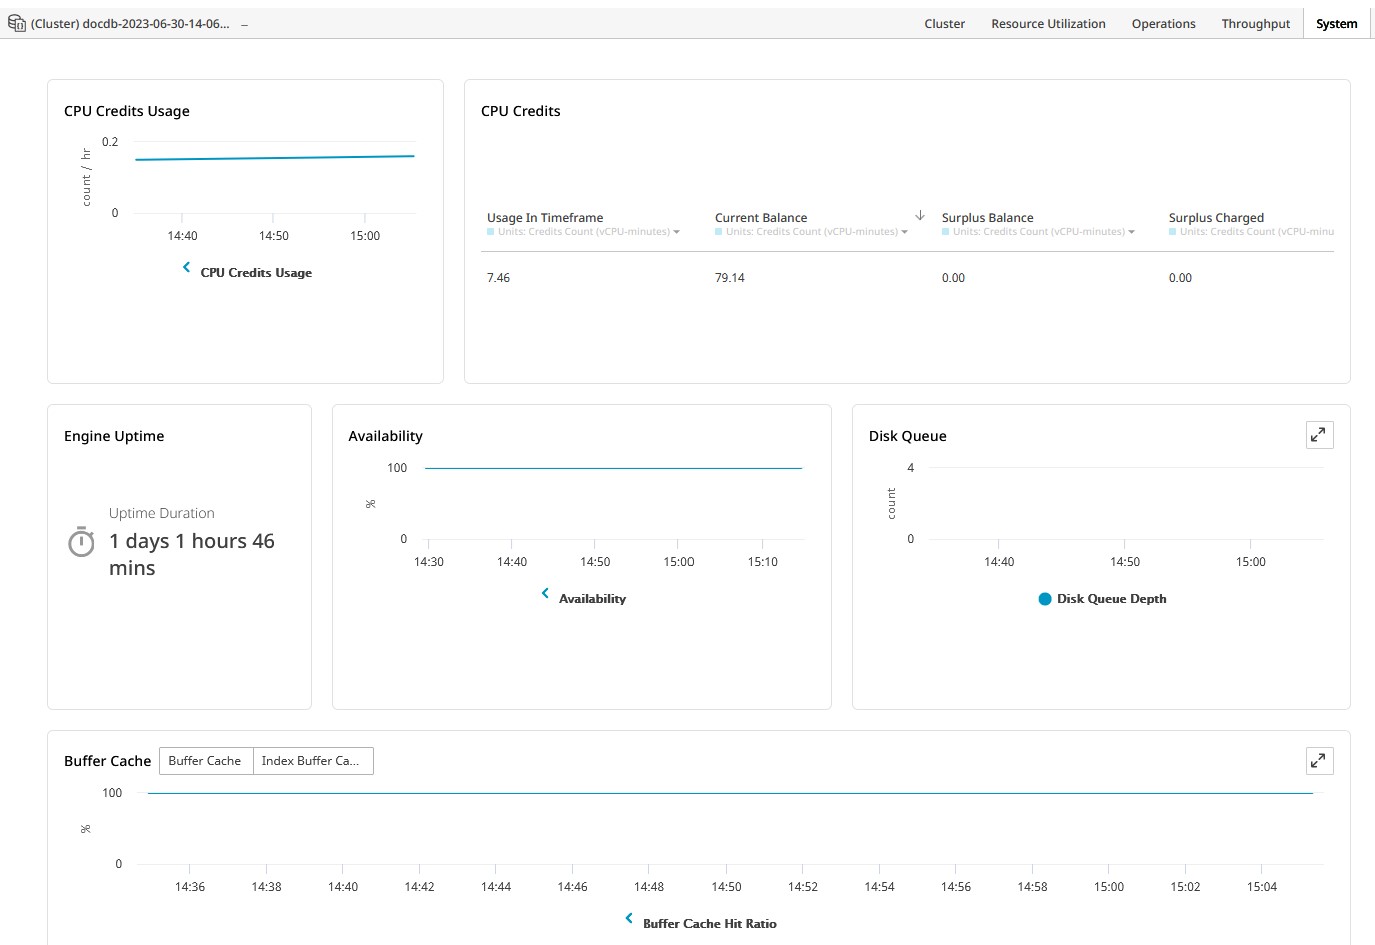
The System dashboard, at either the cluster or instance level, displays CPU credit usage and balance, engine uptime and availability, as well as buffer metrics.
