Installing and Configuring Agents
To start monitoring MongoDB with Foglight, perform the following installation instructions in the given order:
Configuring the Environment
The agent requires a user account with specific privileges to run system-level queries. If the database server is configured to support or require TLS/SSL, additional steps are necessary to allow a secure connection between the agent and the database.
To collect profiled operation data, profiling must be enabled on each MongoDB instance at the database level.
To collect slow operation entries from the MongoDB log, an SSH user must be created on the database host. This requirement applies only to Linux-based hosts.
Database User
The MongoDB agent requires database user credentials with a minimum set of privileges to fully monitor the server and cluster. All user authorizations must be granted in the admin database. The specific roles required may vary depending on the MongoDB version.
When monitoring a sharded cluster, a separate database user must be created for each component replica set—this includes the config server replica set and each shard replica set.
The provided code examples for creating a database user assume the use of the default authentication method. If your environment uses a non-default authentication method—such as x.509 or LDAP, where the user is created in the $external database—you may need to modify the examples accordingly.
For MongoDB 3.0 and later, the following roles on the admin database are required: clusterMonitor, readAnyDatabase.
User creation script sample:
db.getSiblingDB('admin').createUser({
    user: '<xxx>',
    pwd: '<yyy>',
    roles: ['clusterMonitor', 'readAnyDatabase']
})
For versions prior to MongoDB 3.0 the following roles are required: clusterAdmin, dbAdminAnyDatabase, readAnyDatabase.
User creation script sample:
db.getSiblingDB('admin').addUser({
    user: '<xxx>',
    pwd: '<yyy>',
    roles: ['clusterAdmin', 'dbAdminAnyDatabase', 'readAnyDatabase']
})
Additional privileges are required for monitoring users and roles, which is available starting with MongoDB 2.6. Specifically, the viewUser and viewRole privilege actions are required on any databases for which user and role data is to be collected. The following sample script creates a new role that enables monitoring users and roles on all databases and then grants it to a user called foglightAgent:
db.getSiblingDB('admin').createRole({
    role: 'viewAllUsersAndRoles',
    privileges: [{ resource: { db: '', collection: '' }, actions: ['viewUser', 'viewRole'] }],
    roles: []
})
db.getSiblingDB('admin').grantRolesToUser('foglightAgent', ['viewAllUsersAndRoles'])
If you are running on-prem MongoDB 8.0+ configured as a Sharded Cluster, the user must also be granted the directShardOperations role on the admin database.
User creation script sample:
db.getSiblingDB('admin').createUser({
    user: '<xxx>',
    pwd: '<yyy>',
    roles: ['clusterMonitor', 'readAnyDatabase', 'directShardOperations']
})
Finally, ensure that all firewalls and network configurations allow the machine running the FglAM to access the host of each monitored server at its configured port.
Configuring an SSL Connection
The below instructions cover common steps used to configure a TLS/SSL connection from the MongoDB Agent client. For full information on secure connections and server-side configuration, refer to the TLS/SSL Configuration for Clients section of the MongoDB documentation for your database version.
A complete explanation of TLS/SSL keys, certificates, and certificate authorities (CAs) is beyond the scope of this document. These instructions assume that you are already familiar with TLS/SSL concepts and tools. Ensure that the required client and CA certificates are available before proceeding.
To use SSL, the MongoDB server must be built with SSL support and configured to allow SSL connections. Several configuration options are available for client connections. Refer to the MongoDB documentation to verify that the server’s current configuration parameters support your intended authentication method.
As a database client, the Foglight agent requires access to a private key, its corresponding signed certificate, and the certificate of the signing CA. The client key and certificate must be imported into a keystore. The CA certificate must be imported into a separate truststore.
One way to generate a JKS keystore for use with Foglight is by using openssl and keytool. Set the key and certificate filenames, alias name, and keystore password as needed.
openssl pkcs12 \
        -export \
        -in ${CERT_NAME}.crt \
        -inkey ${CERT_NAME}.key \
        -name $CERT_NAME \
        -out temp-keystore.p12 \
        -passout pass:${KEYPASS}

keytool -importkeystore \
        -srckeystore temp-keystore.p12 \
        -srcstoretype PKCS12 \
        -srcstorepass $KEYPASS \
        -destkeystore keystore \
        -deststoretype JKS \
        -deststorepass $KEYPASS
Regardless of how the keystore is constructed, it must list the client certificate as a ‘PrivateKeyEntry’, indicating that it also contains the private key, not just the signed certificate.
Separately, import the CA certificate into a truststore:
keytool -importcert \
        -keystore truststore \
        -alias $CA_NAME \
        -file ${CA_NAME}.crt \
        -keypass $TRUSTPASS \
        -storepass $TRUSTPASS \
        -storetype JKS \
        -noprompt
Next, edit the baseline.jvmargs.config file in the <FglAM-install-root>/state/default/config directory and add the following parameters with file paths and passwords appropriate for your system.
vmparameter.0 = "-Djavax.net.ssl.keyStore=/path/to/keystore";
vmparameter.1 = "-Djavax.net.ssl.keyStorePassword=changeit";
vmparameter.2 = "-Djavax.net.ssl.trustStore=/path/to/truststore";
vmparameter.3 = "-Djavax.net.ssl.trustStorePassword=changeit";
Escape any quotes with a doubled backslash (’\’). On an Agent Manager installed on Windows, use forward slashes in the file paths, like so:
vmparameter.0 = "-Djavax.net.ssl.keyStore=\\"C:/path/to/keystore\\"";
Then, restart the FglAM and continue with the agent configuration, setting the Use TLS/SSL? option in the Agent Properties to true. If the client certificate is not configured specifically for the FglAM host, you can also set the Allow Invalid Cert Hostname? option to true to allow the certificate to be used anyway.
Determining Atlas Host Addresses
If the monitoring target is hosted in the MongoDB Atlas environment, the host address and port to use when setting up the Foglight agent must first be retrieved from the monitoring target’s local database. Do not use an address copied from the options in the “Connect” dialog on the Atlas web dashboard. Instead, connect to the MongoDB instance. For example, via mongosh, and execute the following JavaScript code to retrieve a valid host address and port.
function getMonitoringAddress() {
    var theDb = db.getMongo().getDB('local')
    for (var member of theDb.system.replset.find().next().members) {
        if (!member.arbiterOnly) {
            var hostPort = member.host .split(':')
            return {
                'host': hostPort[0],
                'port': hostPort[1],
            }
        }
    }
    return 'Unable to find non-arbiter member of replica set'
}
getMonitoringAddress()
The script returns output in the following format:
{ host: 'atlas-xxx-shard-nn-nn.xxx.mongodb.net', port: '27017' }
Take note of the host and port values for use when configuring the agent. Refer to Setting Agent Properties.
Log Monitoring Prerequisites
Foglight requires an SSH connection to access the Host running your MongoDB server to process log files. Ensure that there are no firewall or networking restrictions between the agent and the Host running the MongoDB server being monitored.
The Foglight for MongoDB cartridge uses the Foglight Credentials system to securely manage credentials for your MongoDB hosts. You must set up the credentials to enable the cartridge to establish SSH connections. The credentials should be associated with the monitoring user (or any user with permission to execute shell commands on the monitored host).
Current limitations
Foglight supports only RSA and DSA keys. If you configure a key pair to access the server, add the following configuration to the sshd_config file of your Host machine running the MongoDB server to prevent connection issues:
- HostKeyAlgorithms +ssh-rsa
- PubkeyAcceptedAlgorithms +ssh-rsa
If you plan to use username and password authentication, then only the following configuration parameter is required:
- HostKeyAlgorithms +ssh-rsa
Restart the SSH service of the server after making the change.
Setting the Credential
To set the credentials:
- Navigate to Administration > Credentials in the left pane.
- On the Credentials dashboard, click Manage Credentials.
- On the Manage Credentials dashboard click Add.
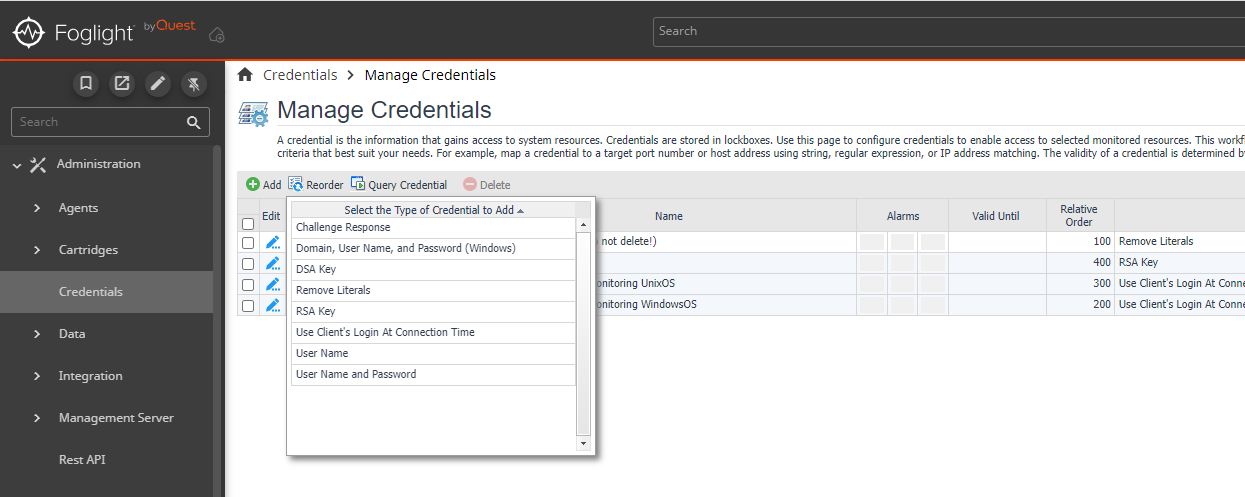
- You can select any of the following types of credentials depending on your system configuration or preference:
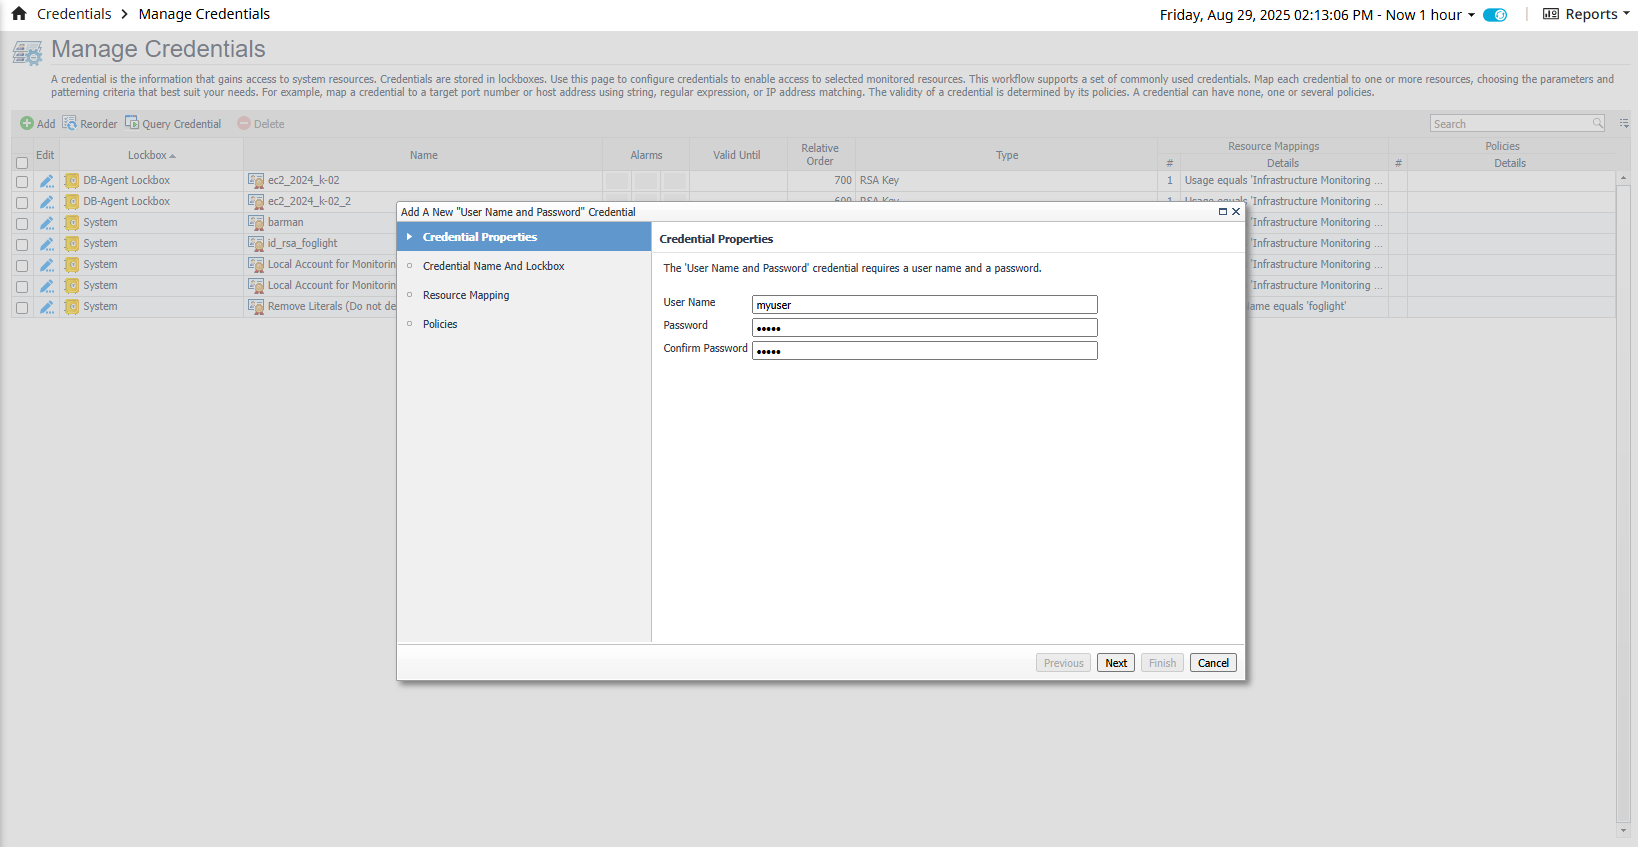
Username and Password - Add the Username and Password.
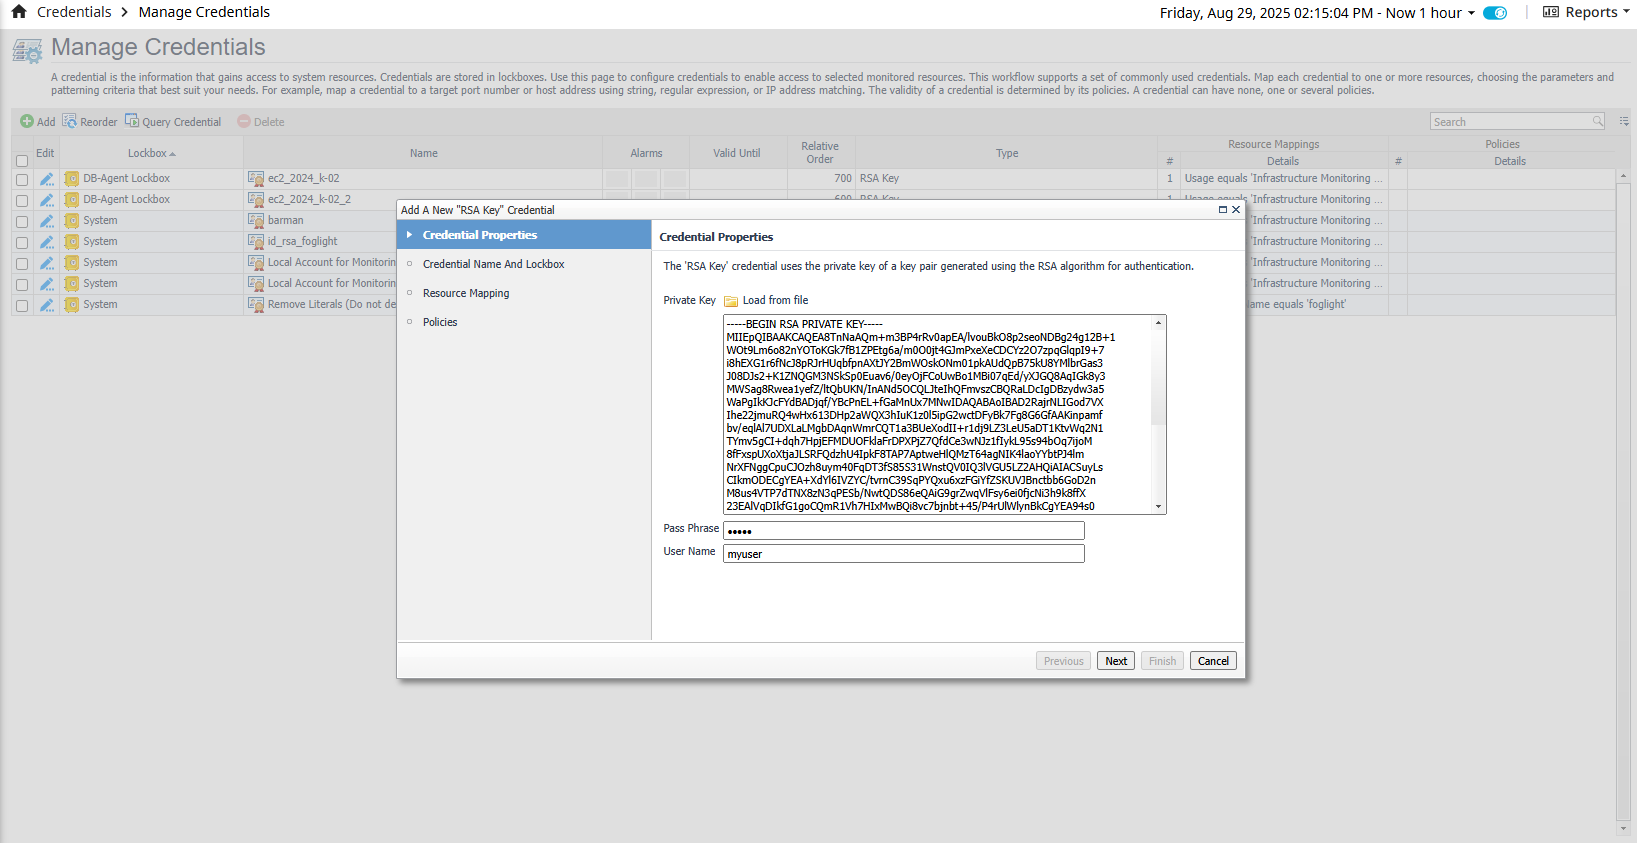
RSA Key - Generate a new RSA key using the following commands (use -m PEM to ensure the key is in PEM format):
ssh-keygen -t rsa -m PEMFollow the command prompts to generate the key pair. You will be required to provide a passphrase for the key. After generating the RSA key pair, add the public key to the ~/.ssh/authorized_keys file for the respective account.
cat id_rsa.pub >> ~/.ssh/authorized_keysAdd this public key to the monitoring user or any user that can execute ssh commands, otherwise data collection will fail.
Once the key/pair is created and added to the authorized_hosts file, check if you can use it to connect to the host.The permissions on the .ssh directory should be 700, and the permissions on the authorized_keys file (./ssh/authorized_keys) should be 600.
ssh -i id_rsa user@examplehost.comIf it works, create a new credential and load the private key to Foglight.
DSA Key - Follow the same steps as for the RSA key creation except create the key pair using DSA format.
ssh-keygen -t dsa -m PEM
 Click Next.
- Credential Name and Lockbox - After adding the new credential properties, you can select either the existing System Lockbox or create your own.
Do not select the DB-Agent Lockbox option.
If you create a new Lockbox you need to Manage the credential release in the Administration > Credentials > Manage Lockbox section.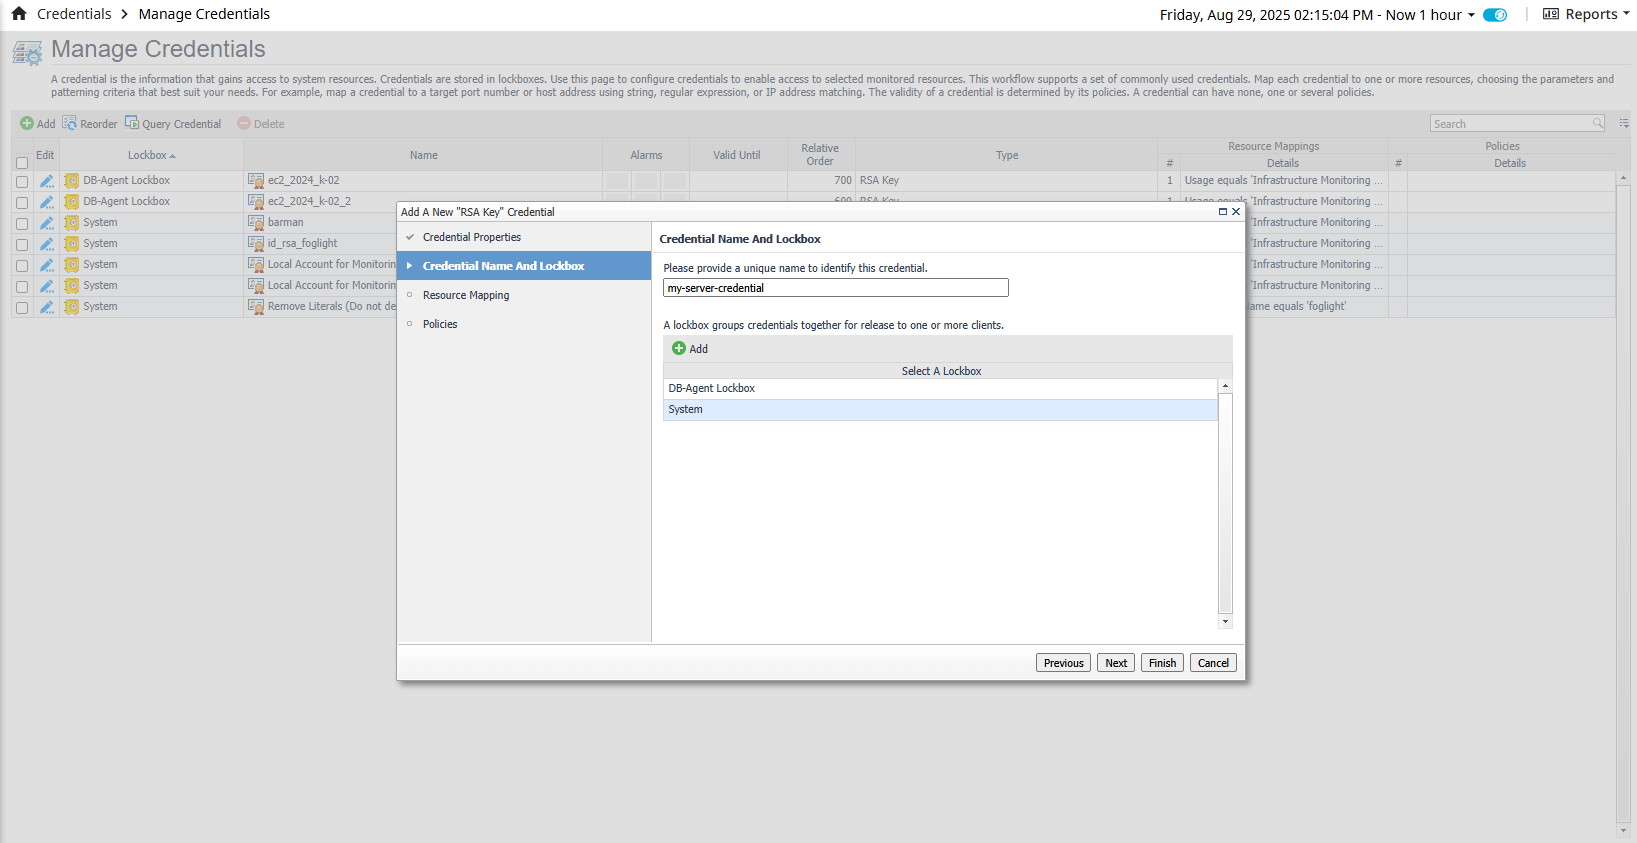 Click Next.
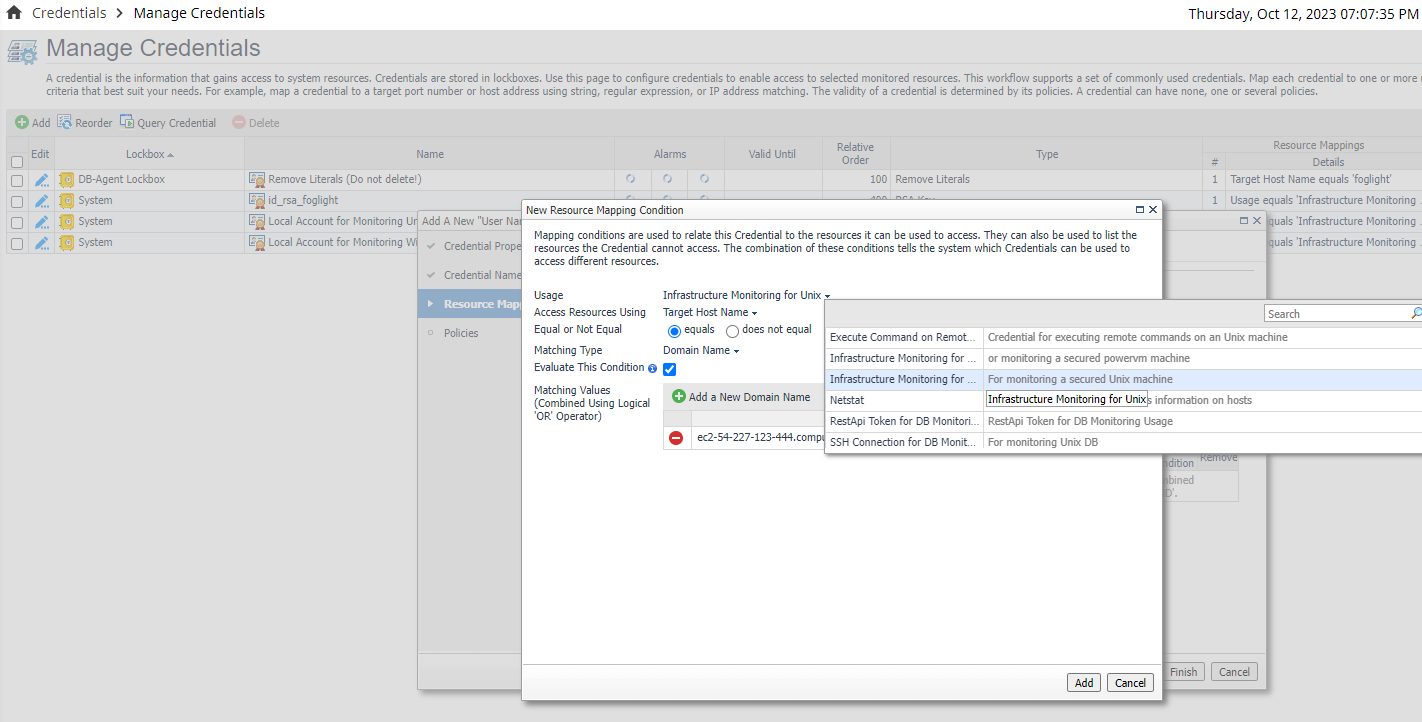
- Resource Mapping - The resource mapping section is used to map the credential to a given resource. Click Add and select the following options:
- Usage: Infrastructure Monitoring for Unix
- Access Resources Using: You can select between Target Host Name or Target Host Address
- Equal or Not Equal: equals
- Matching Type: Select the correct matching type for your case. If you have selected Target Host Name in the Access Resource Using section, then you can select the Domain Name option and input the host domain name that is running your MongoDB instance. If you have selected Target Host Address, then you can select Exact Match or any of the options that suit your needs. Regardless of your choice, verify that you are using the correct Host or IP Address for the MongoDB host.
 Click Next.
- Policies - Policies are optional and not required for log file monitoring. Click Finish.
Enabling Profiling
Operation profiling is disabled by default on MongoDB servers. If profiling information is desired for monitoring purposes, profiling must be enabled in MongoDB. Profiling is enabled on an instance-by-instance and database-by-database basis. So if, for example, profiling for a specific database is desired across a three instance replica set, profiling can be enabled on the primary only or on all three instances, as desired. Profiling on MongoDB does impact database performance, and should be used judiciously in production environments. For more information see Database Profiling Overhead.
To enable profiling, first connect to the MongoDB instance with the mongo shell. The database user must be assigned a role with the enableProfiler privilege action on the respective database. An example of a built-in role that permits profiler enabling on non-system databases is dbAdmin.
Switch to the database for which profiling should be enabled. Replace <db-name> below with the name of the database:
use <db-name>;
To check the current profiling status, execute:
db.getProfilingStatus()
Modify the profiling level by executing the setProfilingLevel command. For example, the following command will enable profiling for all operations taking longer than 250 milliseconds:
db.setProfilingLevel(1, { slowms: 250 })
This is only an example of using the setProfilingLevel command and should not be taken as a recommendation for your database. For full details and options for using this command, see setProfilingLevel.
Creating Agents
The simplest way to create a new agent is to navigate to the Databases dashboard, click on the Monitor button, and select MongoDB. Following the instructions in the Agent Installer Wizard popup to create a new Foglight for MongoDB agent.
Using the Agent Installer Wizard
Foglight for MongoDB provides a graphic, intuitive method for creating and configuring agents. To run the instance installation wizard:
- Open the Databases dashboard from the left menu.
- In the databases table, click the Monitor button and select MongoDB.
- The Agent Installer Wizard dialog box appears.
- The Agent Deployment card has two fields:
a. Agent Name – Provide a name for the agent that will be created. This is not canonical and should be representative of the database instance that this agent will monitor.
b. Agent Manager - Select the agent manager on which the agent should run. Considerations for this may include physical or virtual locality to the monitored instance, allocated resources, or grouping with other agents of the same type or monitored environment. If the agent package has not been deployed to this Agent Manager yet, it will be installed when the first agent of this type is created. - The Agent Properties card accepts a basic set of parameters for connecting to and monitoring the database instance.
- The Agent Summary card displays a review of the configuration that will be created and an option allowing the agent to be activated after creation. If the configuration looks good, click the Finish button to start the process.
- When the process completes, a results screen will appear showing the results of agent creation. If the agent was not created, follow the instructions on the results screen. If successful, the database instance should appear in the Databases table within a few minutes.
To check on the status of the newly created agent, navigate to Administration > Agents > Agent Status and click the icon in the Log File column for the relevant agent.
Using the Agent Status Dashboard
The Agent Status dashboard can be used to create new agents and configure and manage existing agents. To access the page from the navigation pane, select Administration > Agents > Agent Status.
To create a new agent instance:
- Deploy the MongoDB agent package to the FglAM hosting the agent before creating an agent. You can click Deploy Agent Package on the Agent Status or Agent Managers page to perform this.
- Click Create Agent and follow the instructions on the wizard:
a. Host Selector - Select the Agent Manager on which the agent should run. Considerations for this may include physical or virtual locality to the monitored instance, allocated resources, or grouping with other agents of the same type or monitored environment.
b. Agent Type and Instance Name – Select the MongoDBAgent type. Then, select the Specify Name radio button and enter the agent instance name to be created in the Name field. This is representative of the database instance that the agent will monitor, rather than canonical.
c. Summary – Click Finish. - Once the agent gets created, select the checkbox against its name.
- Click Edit Properties.
- Select Modify the default properties for this agent.
- Edit the agent properties.
- Click Activate.
To modify the properties of an existing agent, skip to step 3, deactivate the agent, update the configuration, and then reactivate it.
Setting Agent Properties
For new agents, the default values can be accepted for most fields. Database connections must be configured.
Database Connection
Add one row in the connections list for each mongos query server, config server, and mongod data server in the sharded cluster or replica set to be monitored. Do not add rows for arbiters.
- Ensure that the default DBConnectionsList is selected.
- Click Clone and give the new list a name relevant to the agent.
- Click Edit (with the newly cloned list selected).
- Enter the required fields Host, Port, User, and Password. If slow operations are to be monitored from the database log, set Log Directory and Log File. The remaining fields may be left at the defaults.
- Click Save.
Collection Periods
The Collection Period fields in the agent properties are used to set the sample frequencies. Before you modify the periods for an agent, make a copy of the default period list and modify the copy.
- Connection Status - Period for MongoDB availability monitoring. Default value is 30 seconds.
- Server - Period for MongoDB server monitoring. Default value is 300 seconds.
- Database - Period for MongoDB database monitoring. Default value is 300 seconds.
- Collection - Period for MongoDB collection monitoring. Default value is 900 seconds.
- Top - Period for MongoDB top activity monitoring. Default value is 300 seconds.
- Shard - Period for MongoDB shard monitoring. Default value is 600 seconds.
- Replication - Period for MongoDB replication monitoring. Default value is 300 seconds.
- Profiled Ops Aggregates - Period for profiled operation aggregate monitoring. Default value is 900 seconds.
- Profiled Ops Buffer - Period for profiled operation buffer monitoring. Default value is 900 seconds.
- Slow Ops - Period for slow operation monitoring. Default value is 300 seconds.
- Current Ops - Period for current operation monitoring. Default value is 300 seconds.
- Role - Period for MongoDB role monitoring. Default value is 900 seconds.
- Parameters - Period for parameters monitoring. Default value is 3600 seconds.
- Log Cache - Period for log cache monitoring. Default value is 600 seconds.
Log
- Maximum entries to retrieve – The maximum number of log entries to retrieve per instance, per collection period. Set to zero to disable the log collection for all MongoDB instances monitored by the agent.
- Log entry match list – A list of rules specifying conditions for when log entries should cause a Foglight alert to fire. Consists of a severity level found in the log entry, a regular expression text to search for in the log entry message text and the Foglight severity at which to fire an alarm if a match is found. Any entry with a log severity more extreme than the one provided in the list will naturally also trigger an alarm. Note that the log entry match list works by submitting data through the agent that will cause the rule MongoDB Log Patterns to trigger. Hence if this rule is disabled, no alerts will fire on log entries even if the match list has been set up with matching conditions.
- Log entry ignore list – The ignore list looks much like the match list except that it prevents triggering of the rule MongoDB Log Patterns. If a collected log entry matches a rule in the match list, it will only fire if it does not also match a rule in the ignore list.
Profiled Operations
- Max Profiled Ops DBs – The maximum number of databases from which to collect profiled operations. Set to zero to disable profiled operation collection. The maximum allowed value is 100.
- DB Allow List – An optional list of database names to either allow or disallow. If any entry is disallowed, then data on all non-disallowed databases will be collected, otherwise only data for the specifically allowed databases will be collected. Providing an empty list allows all databases.
- Max Profiled Ops – The maximum number of profiled operations to collect in each collection period.
- Command Max Characters – The maximum character length of the profiled operation command text to store. Set to zero to disable command text collection.
- Sort Aggregated Ops By – The numerical property by which to select the top profiled operations. Available metrics are: Average Time, Executions, Max Time, and Total Time.
- In-Memory Buffer Size – The size of the in-memory buffer used to store the profiled operations buffer data (individual operations). This buffer resides on the Foglight Agent Manager and contributes to its memory usage. Set to zero to disable the profiled operations buffer collection. The maximum allowed value is 10 MB.
Slow Operations
- Slow Ops Threshold Millis – The threshold of the smallest duration slow operations to collect.
- Max Slow Ops – The maximum number of slow operations to collect in each collection period.
- SSH Timeout – The millisecond duration to wait before failing an SSH connection to the database host while attempting to read the slow operations log.
- Log Read Max Duration – The second duration to allow the agent to continue processing the slow operations log.
Options
- Host Aliases – A list of hostnames or IP addresses mapped to aliases. Can be used to standardize discovered hostnames from internal representations (e.g., in a cloud environment) to their external address. Enables, for example, the MongoDB cartridge to link directly to the Hosts dashboard by ensuring host data is submitted uniformly across the monitoring environment.
- Replica Set Aliases – A mapping from actual replica set names to aliases. This alias map is required to prevent collisions in collected data between different replica sets with the same name. Ideally, each replica set in an environment should be set up with a unique name.
- Cluster Alias – An arbitrary human-friendly name to display in place of the UUID cluster ID. Only used for sharded clusters.
- Max Databases – The maximum number of the databases to collect each period, selected by database size.
- Max Collections – The maximum number of the collections to collect each period, selected by collection size.
- Enable Dynamic Memory Allocation? – Select yes to enable dynamic memory allocation. In this case memory may be added to the environment as the number of monitored MongoDB collections grows. If set to false, memory allocation is performed by the agent manager on a per-agent basis only.
- Availability Timeout (sec) – The time to wait in seconds before a connection to a MongoDB server is considered to have failed.
- Log Level – Switch between default, debug, and verbose debug logging