Viewing Dashboards
The installation of the PostgreSQL Cartridge includes the PostgreSQL Dashboards. The PostgreSQL Cartridge offers these principal dashboards:
- Background Writer
- Connections
- Current Locks
- Databases
- Functions
- Indexes
- Replication
- Publications
- Subscriptions
- Server Overview
- Statement Details
- Statements
- Tables
- Tablespaces
Drill downs from these dashboards are available to expose more granular data. It should be noted that there is a great deal of additional information that is collected that is not displayed in these primary dashboards. Should an operator wish to have that information displayed, Foglight allows for the creation of simple drag and drop dashboards.
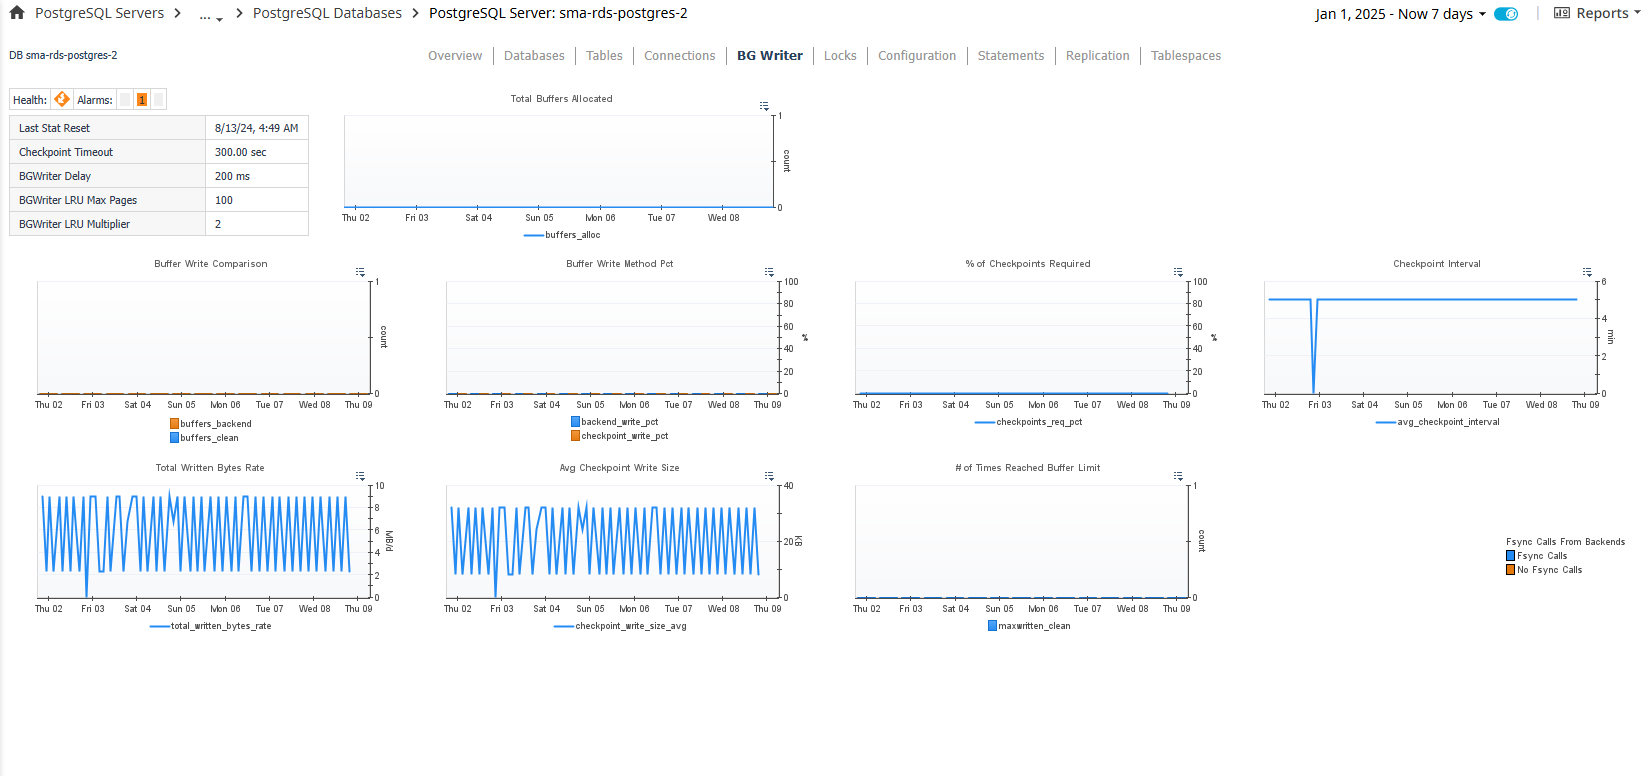
Background Writer
The Background Writer page shows important configuration information as well as performance metrics related to the background writer.
Data
Top-left Table Section
- Health – Shows the overall health of the background writer.
- Alarms – Provides counts of the alarms for this agent, separated by severity.
- Last Stat Reset – Time when statistic counters for the background writer were last reset.
- Checkpoint Timeout – Maximum amount of time between automatic WAL checkpoint writes. If checkpoint segment limit is not reached before this time, a checkpoint will be triggered.
- BGWriter Delay – Delay between activity rounds for the background writer.
- BGWriter LRU Max Pages – Maximum number of pages written per activity round.
- BGWriter LRU Multiplier –Multiplier used to calculate the number of dirty buffers written for a given activity round
Graphs
- Total Buffers Allocated – Number of buffers allocated for use by the background writer.
- Buffer Write Comparison – Compares number of buffers written by a backend vs. being written by the background writer.
- Buffer Write Method Pct – Compares percent of buffers written by a backend vs. percent of buffers written during normal checkpoints.
- % of Checkpoints Required - Percent of checkpoints executed that were required. Low percent indicates system has not been active enough to reach WAL segment limit before reaching the checkpoint timeout limit.
- Checkpoint Interval – Average elapsed time between checkpoints.
- Total Written Bytes Rate – Rate of total data written into Write Ahead Log.
- Avg Checkpoint Write Size – Average amount of data written into WAL during checkpoints.
- # of Time Reached Buffer Limit – Number of times the background writer stopped a cleaning scan because it had written too many buffers.
- Fsync Calls From Backends – Compares number of times a backend had to execute its own fsync call (normally handled by the background writer even when the backend does its own write).
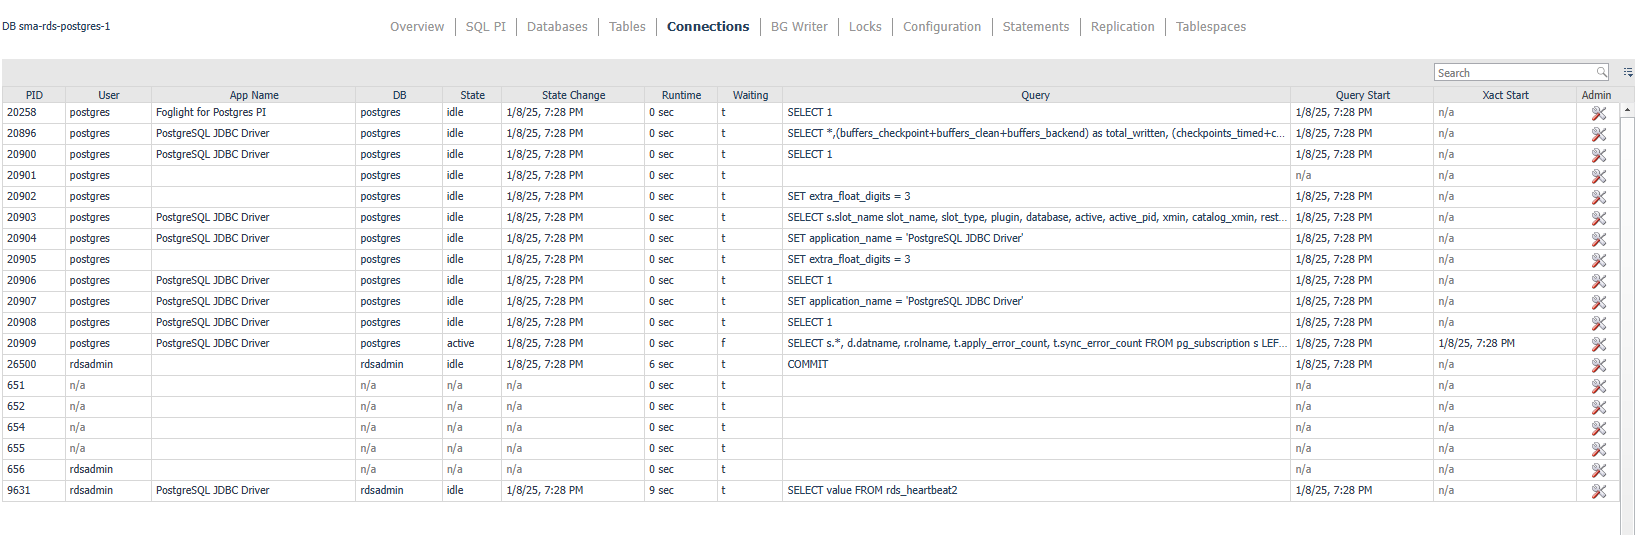
Connections
The Connections page shows active connections in the server from the last server data sample and related information. In the action panel on the right pane, the DB Selector allows you to switch between databases or show connections from all databases.
Data
- PID – Process ID of the connection.
- User – The user name that owns the connection.
- App Name – The application where the connection originated from, if provided in the connection string.
- DB – Name of the database the connection is connected to.
- State – Current overall state of the connection.
- State Change – Time when the last time the connection state was changed.
- Runtime – How long the connection has existed.
- Waiting – Whether or not the connection is waiting for a lock to open in order to perform its query.
- Wait Event – Wait event type if the connection is waiting (9.6+).
- Wait Event Type – Wait event name if the connection is waiting (9.6+).
- Query – Current or last query executed by the connection. Shown in an abbreviated state in order to fit in the table cell.
- Query Start – Time when the currently active query was started or start of the last query if not active.
- Xact Start – Time when the connection’s current transaction was started or null if no transaction is active.
Actions
- DB (drilldown) – Navigates to the Databases dashboard with DB selected.
- Query (dwell or drilldown) - Shows the full query text in a formatted, colored state for better readability.
Admin Actions
If your user account has the PostgreSQL Administrator role and the PostgreSQL user provided to the agent has the appropriate permissions, you can perform administrative actions on the server from the dashboard. Click the icon in the Admin table column to perform one of the following actions:
- Cancel – Cancel the current query of the connection.
- Terminate – Terminates the connection, that is, kills the process.
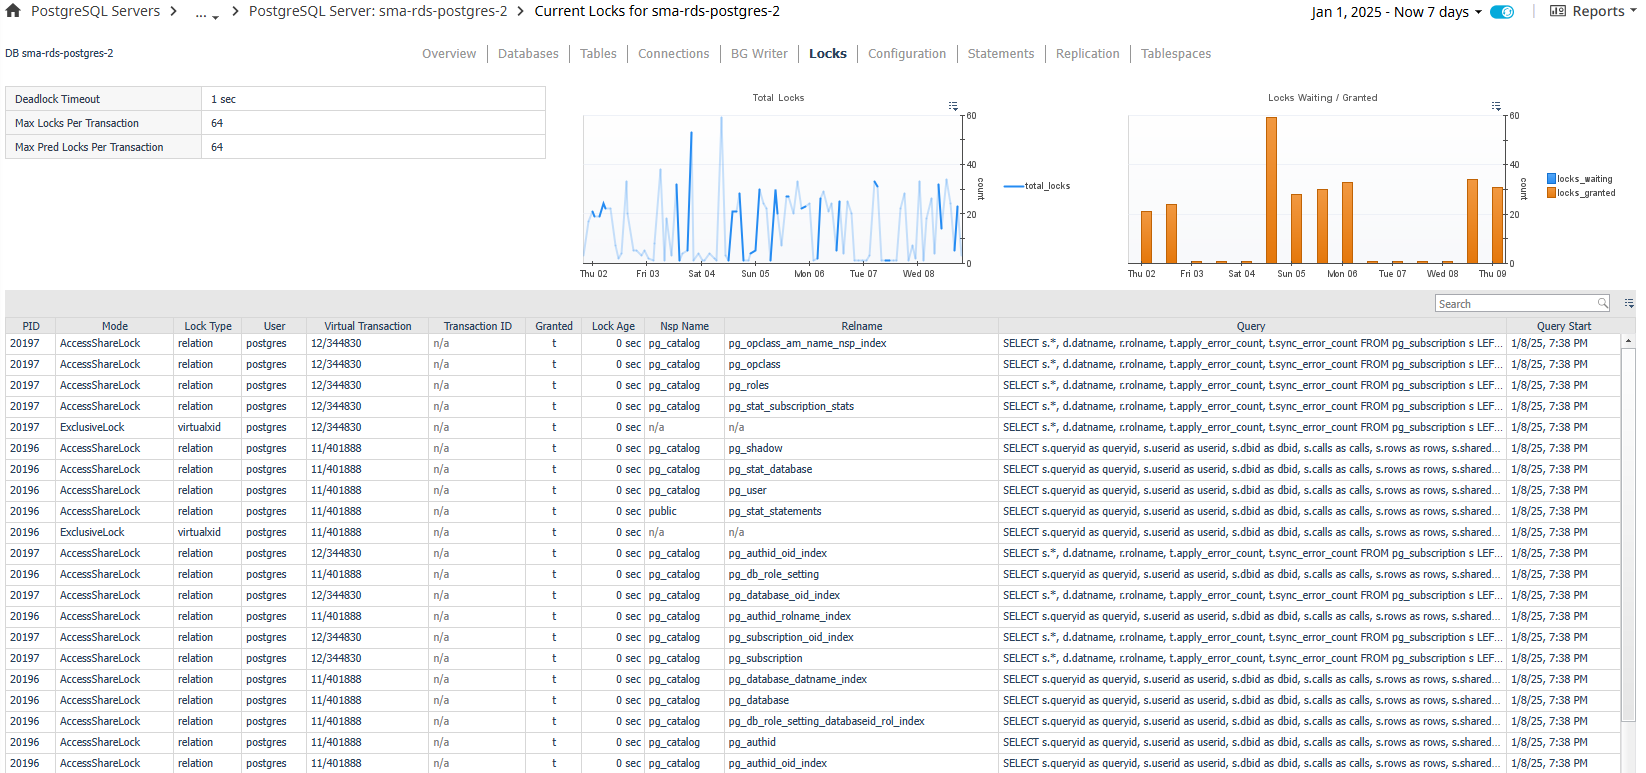
Current Locks
The Current Locks page shows current locks in the server from the last server data sample and related information. In the action panel on the right pane, the PostgreSQL Agent Selector allows you to switch between PostgreSQL servers.
Data
Top-left Table Section
- Deadlock Timeout – The amount of time that the server waits on a lock before checking to see if there is a deadlock condition.
- Max Locks Per Transaction – The average number of object locks allocated for each transaction. Individual transactions can lock an infinite amount of objects, but as a whole, the server cannot allow an average of more than this number across all active transactions.
- Max Pred Locks Per Transaction - The average number of predicate locks allocated for each transaction. Individual transactions can lock an infinite amount of objects, but as a whole, the server cannot allow an average of more than this number across all active transactions.
Top Graphs
- Total Locks – Total locks on the server.
- Locks Waiting/Granted – Shows number of locks waiting and granted.
Table
- PID – Process ID of the lock.
- Mode – Name of the lock mode held or desired by the process.
- Lock Type – Type of the lockable object.
- User – User controlling the backend that requested the lock.
- Virtual Transaction – Virtual ID of the transaction.
- Transaction ID – ID of the transaction targeted by the lock or null if target is not a transaction.
- Granted – True if lock is held, false if it is waiting to be granted.
- Lock Age – How long since lock process started.
- Nsp Name – Name of the namespace.
- Relname – Name of the object targeted by the lock.
- Query – Current or last query executed by the backend. Shown in an abbreviated state in order to fit in the table cell.
- Query Start – Time when the currently active query was started or start of the last query if not active.
Actions
- Query (dwell or drilldown) - Shows the full query text in a formatted, colored state for better readability.
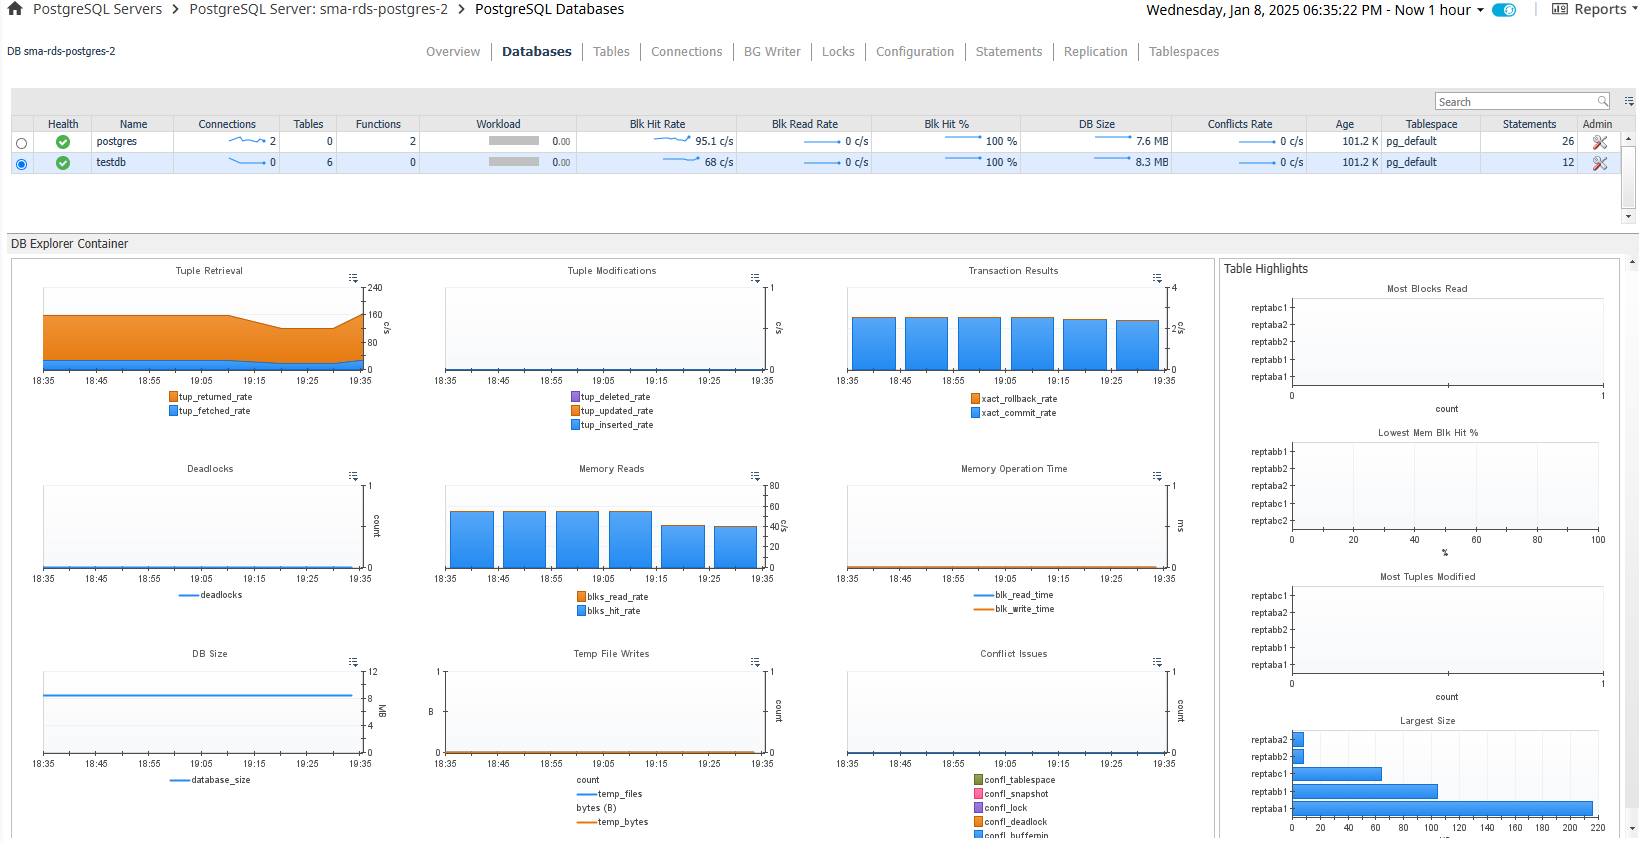
Databases
The Databases dashboard contains 2 sections separated by a horizontal splitter: the top section, which displays a row for each database as well as some key information, and the bottom section, which displays metric information related to the database selected in the top section as well as highlighting tables in that database with the highest or lowest value for a particular metric. The size of the two sections can be increased or decreased by dragging the horizontal splitter bar up or down. In the action panel on the right pane, the PostgreSQL Agent Selector allows you to switch between PostgreSQL servers.
Data
Top Section – DB Table
- Health – Shows the overall health of the database.
- Name – The name of the database.
- Connections – Number of connections to this database.
- Tables – Number of tables in the database.
- Functions – Number of functions in the database.
- Workload – A calculation of time spent reading and writing data file blocks by backends in this database in a sample period, divided by the sample period time. This represents the load on the server and may exceed 1 because of concurrent processing. This is not an estimation of resource usage or availability. Requires track_io_timing to be enabled, available only in v9.2+.
- Blk Hit Rate – Rate at which disk blocks are found already in the buffer cache, so that a read was not necessary.
- Blk Read Rate – Rate at which disk blocks are read from the database.
- Blk Hit % - Percentage where a table read is successfully sourced from buffer cache rather than needing physical disk I/O.
- DB Size – Disk size of this database.
- Conflicts Rate – Rate of queries cancelled due to conflicts with recovery in this database.
- Tablespace – Name of the default tablespace for objects created in this database.
- Statements – The number of statements gathered in the last sample for this database. This collection may be limited due to the # of Top Statements property in the Agent Properties or the pg_stat_statements.max setting on the PostgreSQL server.
Bottom Section – DB Metrics
- Tuple Retrieval – Rate of tuples retrieved with sequential scans (tup_returned_rate) vs. bitmap or simple scans (tup_fetched_rate).
- Tuple Modifications – Rate of tuples modified by deletion, update, or insert operations.
- Transaction Results – Rate of transactions finished with commits or rollback.
- Deadlocks – Number of deadlocks detected in the database.
- Memory Reads – Rate of memory blocks read from buffer cache vs. physical disk.
- Memory Operation Time – Time spent reading or writing data file blocks by backends.
- DB Size – Disk size of the database.
- Temp File Writes – Number of temporary files created by queries in this database and the total data size.
- Conflict Issues – Breakdown of cancelled queries due to conflict by reason.
Bottom Section – Table Highlights
- Most Blocks Read – Tables with the most disk blocks read during queries.
- Lowest Mem Blk Hit % - Tables with the lowest memory block hit %, i.e. tables where data is being read from disk rather than buffer cache.
- Most Tuples Modified – Tables most actively being modified.
- Largest Size – Tables with the largest disk size.
Actions
Database Table
- Health (dwell or drilldown) - Shows a breakdown of child objects in a warning, critical, or fatal state.
- Connections
- Dwell - A popup time plot of connections.
- Drilldown – Navigates to the Current Backends page filtered for selected database.
- Tables (drilldown) – Navigates to the Tables page for the selected database.
- Functions (drilldown) – Navigates to the Functions page for the selected database.
- Blk Hit Rate (dwell) – A popup time plot of the block hit rate.
- Blk Read Rate (dwell) – A popup time plot of the block read rate.
- Blk Hit % (dwell) – A popup time plot of the block hit percentage.
- DB Size (dwell) – A popup time plot of the database size.
- Conflicts Rate (dwell) – A popup time plot of the conflicts rate.
- Tablespace
- Dwell - A popup table with the tablespace’s health, OI, owner, and disk size.
- Drilldown – Navigates to the Tablespaces page.
- Statements (drilldown) – Navigates to the Statements dashboard, filtered for statements only performed on the selected database.
Table Highlights
Clicking on an area of the graph reserved for displaying the metric value for a table will drilldown to the Tables page for that database with the selected table highlighted.
Admin Actions
If your user account has the PostgreSQL Administrator role and the PostgreSQL user provided to the agent has the appropriate permissions, you can perform administrative actions on the server from the dashboard. Click the icon in the Admin table column to perform one of the following actions:
- Vacuum + Analyze – Perform a VACUUM ANALYZE operation on the database.
- Vacuum – Perform a VACUUM operation on the database.
- Analyze – Perform an ANALYZE operation on the database.
- Stat Reset – Reset the statistic counts on the database.
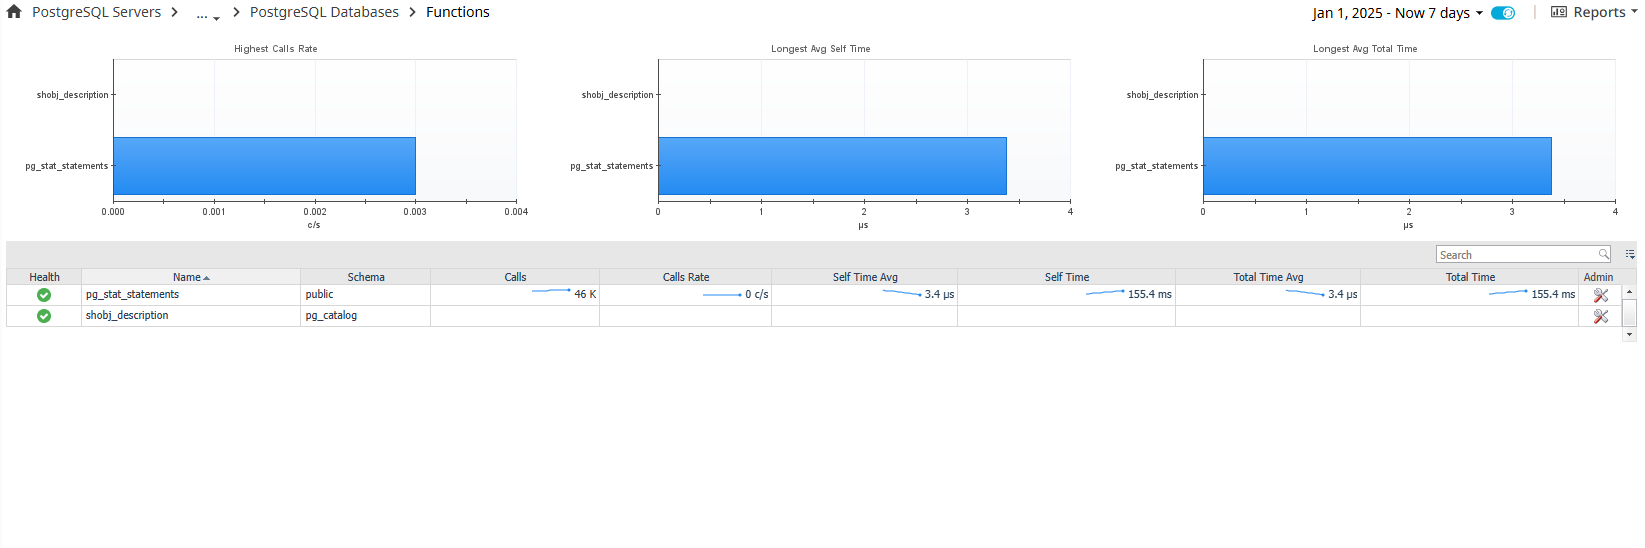
Functions
The Functions page displays statistics on functions for the selected database as well as providing comparisons between functions in the three graphs at the top of the page. Tracking of function call counts and timing requires that track_functions is enabled.
Data
Top Section – Function Comparisons
- Highest Calls Rate – Compares call rates of most frequently called functions.
- Longest Avg Self Time – Compares self time for functions with highest average time.
- Longest Avg Total Time – Compares total time for functions with highest average total time.
Bottom Section – Functions Table
- Health – Shows the overall health of the function.
- OID – OID of the function.
- Name – The name of the function.
- Schema – Schema that owns the function.
- Calls – Number of calls to the function.
- Calls Rate – Rate at which the function is called.
- Self Time Avg – Average time spent in the function, not including calls to other functions.
- Self Time – Total time spent in the function, not including calls to other functions.
- Total Time Avg – Average time spent in the function, including calls to other functions.
- Total Time – Total time spent in the function, including calls to other functions.
Actions
Function Table
- Health (dwell or drilldown) - Shows a breakdown of child objects in a warning, critical, or fatal state.
- Calls – A popup time plot of the number of calls.
- Calls Rate – A popup time plot of the calls rate.
- Self Time Avg – A popup time plot of the average self time.
- Self Time – A popup time plot of the self time.
- Total Time Avg – A popup time plot of the average total time.
- Total Time – A popup time plot of the total time.
Admin Actions
If your user account has the PostgreSQL Administrator role and the PostgreSQL user provided to the agent has the appropriate permissions, you can perform administrative actions on the server from the dashboard. Click the icon in the Admin table column to perform one of the following actions:
- Stat Reset – Resets statistics for the selected function.
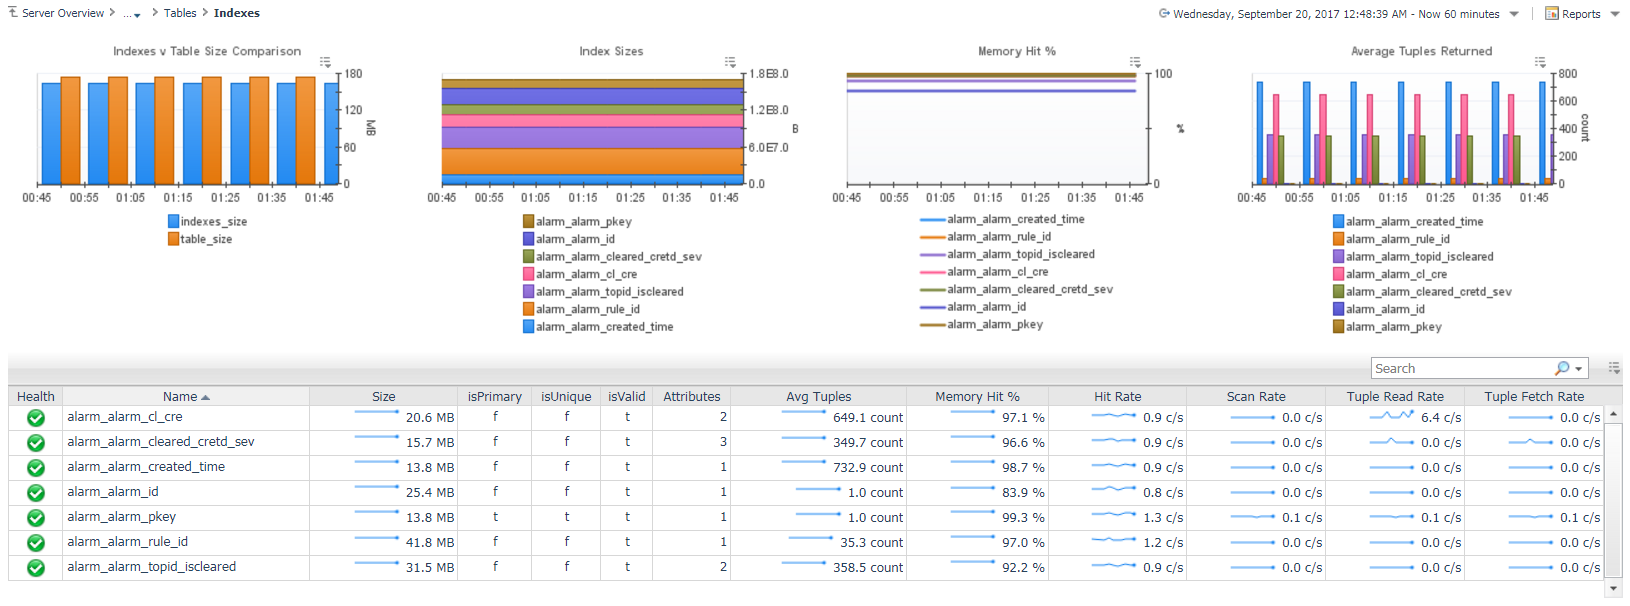
Indexes
The Indexes page displays key information on indexes for the selected database table and provides comparisons between multiple table indexes in the four graphs at the top of the page. To access the Indexes dashboard, go to the PostgreSQL Server dashboard and click Tables. On the Tables dashboard, in Select Databases table click the required index under the Indexes column.
Data
Top Section – Index Comparisons
- Indexes v Table Size Comparison – Compares disk size of table vs. combined table indexes.
- Index sizes – Compares disk sizes of table indexes.
- Memory Hit % - Compares memory hit percentage of indexes.
- Average Tuples Returned – Average number of tuples returned per query.
Bottom Section – Index Table
- Health – Shows the overall health of the index.
- Name – The name of the index.
- Size – Disk size of the index.
- isPrimary – Whether index is the primary index in the table.
- isUnique – Whether index values must be unique.
- isValid – Whether index is configured correctly and can be used as an index.
- Attributes – The number of columns used in the index.
- Avg Tuples – Average number of tuples returned from an index scan.
- Memory Hit % - Percentage where a read from the index is successfully sourced from buffer cache rather than needing physical disk I/O.
- Hit Rate – Rate of buffer hits in this index.
- Scan Rate – Rate of index scans initiated on the index.
- Tuple Read Rate – Number of index entries returned by scans on the index.
- Tuple Fetch Rate – Number of live table rows fetched by simple index scans using the index.
Actions
Index Table
- Health (dwell or drilldown) - Shows a breakdown of child objects in a warning, critical, or fatal state.
- Size (dwell) - A popup time plot of the index size.
- Attributes (dwell) – A popup table of the columns used in the index.
- Avg Tuples – A popup time plot of the average number of tuples returned.
- Memory Hit % - A popup time plot of the memory hit percentage.
- Hit Rate – A popup time plot of the hit rate.
- Scan Rate – A popup time plot of the scan rate.
- Tuple Read Rate – A popup time plot of the tuple read rate.
- Tuple Fetch Rate – A popup time plot of the tuple fetch rate.
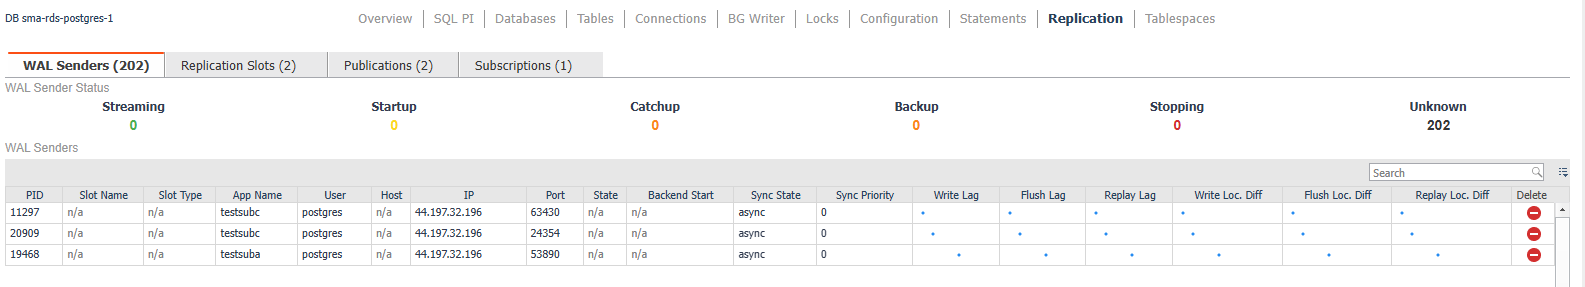
Replication
WAL Senders Overview
The WAL Senders section contains a table that displays one WAL sender per row with configuration and current status information.
WAL Sender Status
- Streaming – Indicates the number of WAL sender processes actively streaming WAL data to replicas in real time.
- Startup – Represents WAL sender processes in the startup phase, preparing to establish a connection or begin streaming.
- Catchup – Refers to WAL sender processes working to catch up replicas with the latest data after a delay.
- Backup – Denotes WAL sender processes engaged in sending WAL data as part of a backup operation.
- Stopping – Represents WAL sender processes that are in the process of shutting down.
Data
- PID – The process ID of the WAL sender.
- App Name – Name of the application connected to the WAL sender process.
- Slot Name: Name of the replication slot, if used.
- Slot Type: Type of the replication slot (e.g., physical or logical).
- Host – Host of the connected WAL receiver client.
- IP – IP address of the connected WAL receiver client.
- Port – Port of the connected WAL receiver client.
- State – Current WAL sender state.
- Synch State – Synchronous state of the standby server.
- Sync Priority – Priority of the current standby server client being chosen as the synchronous standby.
- Standby Lag – Number of WAL segments the standby server is behind as compared to the primary server. If this number increases, it means that the standby server is not able to keep up and replication may eventually be broken.
- Write Location - Last transaction log position written to disk by this standby server.
- Sent Location - Last transaction log position sent on this connection.
- Flush Location - Last transaction log position flushed to disk by this standby server.
- Replay Location - Last transaction log position replayed into the database on this standby server.
Admin Actions
Click the icon in the Delete table column to perform the following action:
- Delete – Delete the WAL Sender topology object if it becomes unnecessary. This will not affect the PostgreSQL server. As Foglight persists topology objects, an object may become redundant or unnecessary when the WAL sender is no longer active. You can manually delete it with this action. If it is still in use, the object will just be recreated.
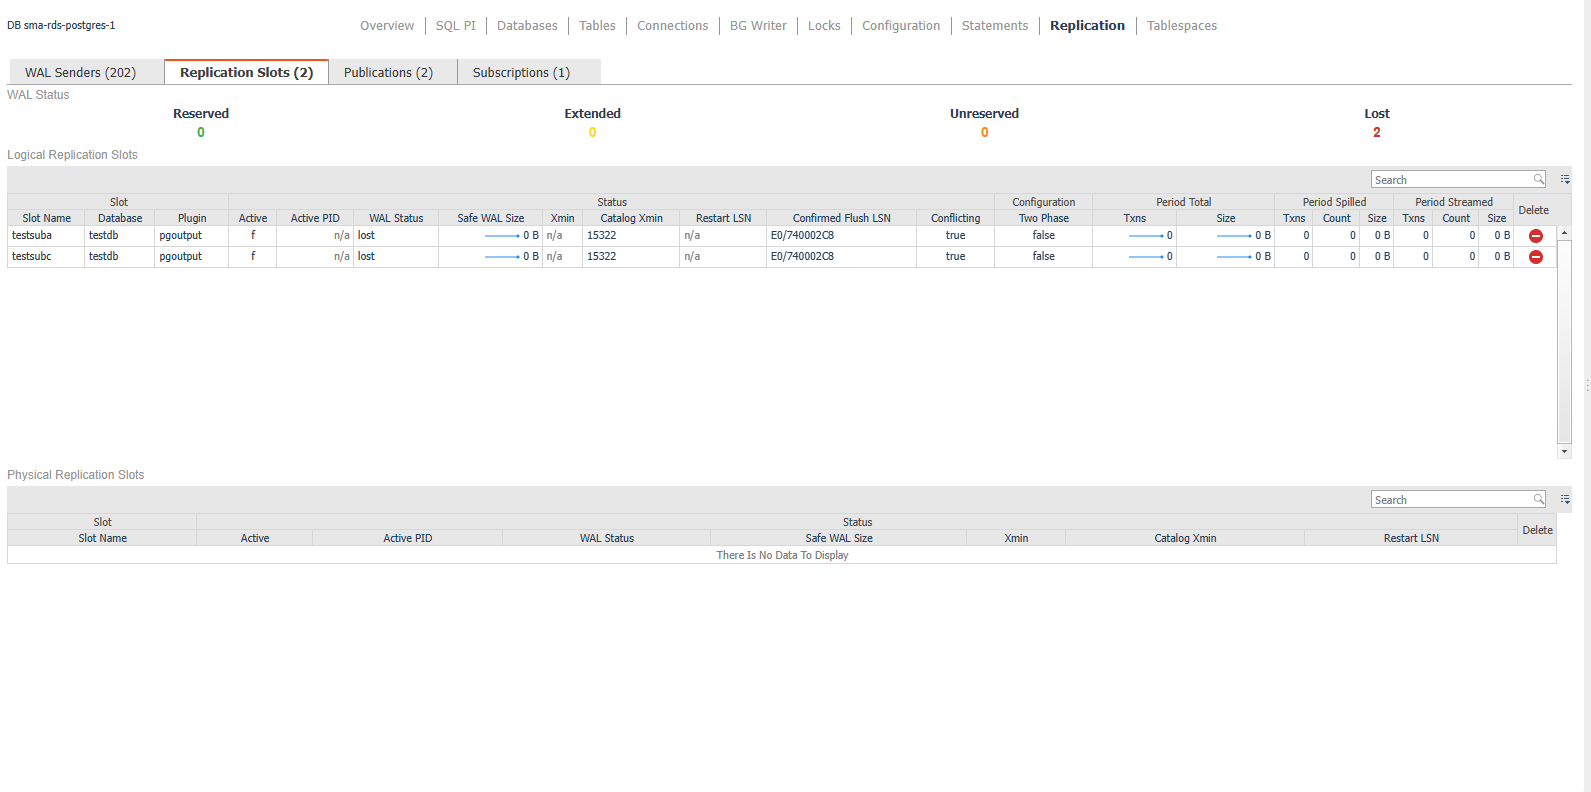
Replication Slots Overview
This dashboard provides insights into the replication slots configured for the PostgreSQL instance. It is divided into sections for logical and physical replication slots, displaying details about their status and metrics.
WAL Status
- Reserved: Count of reserved slots.
- Extended: Count of extended slots.
- Unreserved: Count of unreserved slots.
- Lost: Count of replication slots marked as lost.
Data
- Slot Name: The name of the logical replication slot.
- Database: The database associated with the slot.
- Plugin: The plugin used for logical replication.
- Active: Indicates whether the slot is currently active.
- Active PID: The process ID (PID) associated with the active slot, if applicable.
- WAL Status: Status of the Write-Ahead Log (e.g., active, lost).
- Safe WAL Size: The size of the WAL that is considered safe for the slot.
- Status:
- Xmin: Transaction ID of the oldest transaction.
- Catalog Xmin: The catalog transaction ID.
- Restart LSN: The Log Sequence Number (LSN) where streaming can restart.
- Confirmed Flush LSN: The last LSN flushed and confirmed by the slot.
- Conflicting: Indicates if there are conflicts with this replication slot.
- Configuration:
- Two Phase: Whether two-phase commit is enabled for the slot.
- Period Total:
- Txns: Total number of transactions during the period.
- Size: Total size of WAL data during the period.
- Period Spilled:
- Txns: Number of transactions spilled to disk during the period.
- Count: Number of WAL entries spilled during the period.
- Size: Size of WAL data spilled to disk during the period.
- Period Streamed:
- Txns: Number of transactions streamed during the period.
- Count: Number of WAL entries streamed during the period.
- Size: Size of WAL data streamed during the period.
Admin Actions
Click the icon in the Delete table column to perform the following action:
- Delete – Delete the Replication Slot topology object if it becomes unnecessary. This will not affect the PostgreSQL server. As Foglight persists topology objects, an object may become redundant or unnecessary when the WAL sender is no longer active. You can manually delete it with this action. If it is still in use, the object will just be recreated.
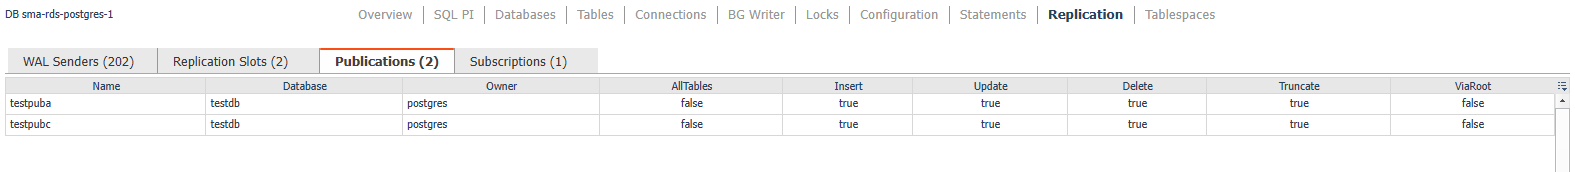
Publications
This table provides an overview of the replication publications set up in the PostgreSQL instance
Data
- Name: The name of the publication.
- Database: The name of the database where the publication is defined.
- Owner: The role or user who owns the publication.
- AllTables: Indicates whether the publication includes all tables in the database.
- Insert: Specifies if the publication includes INSERT operations.
- Update: Specifies if the publication includes UPDATE operations.
- Delete: Specifies if the publication includes DELETE operations.
- Truncate: Specifies if the publication includes TRUNCATE operations.
- ViaRoot: Indicates whether the publication is applied via a root role.
Subscriptions
Overview
This table provides an overview of the replication subscriptions set up in the PostgreSQL instance
Data
- Name: The name of the subscription.
- Database: The name of the database where the subscription is defined.
- Owner: The user or role that owns the subscription.
- Slot: The replication slot used by the subscription to keep track of the WAL (Write-Ahead Log) positions.
- Enabled: Indicates whether the subscription is enabled.
- TwoPhaseState: Shows the state of the two-phase commit.
- Publications: Lists the publications the subscription is subscribing to.
- Workers: The number of workers assigned to this subscription.
- SkipLSN: The Log Sequence Number (LSN) position to skip during replication.
- Error Counts:
- Apply: Errors during applying changes.
- Sync: Errors during synchronization.
- Binary: Indicates whether the subscription transfers data in binary format.
- Stream: Specifies if streaming replication is enabled.
- DisableOnErr: Indicates if the subscription should be disabled on error.
- Configuration
- PasswordRequired: Specifies whether a password is required for the subscription.
- RunAsOwner: Indicates if the subscription runs with the owner’s permissions.
- SyncCommit: The synchronization commit setting.
- Origin: The origin of the replication data.

Server Overview
The Server Overview dashboard gives an overview of key segments for the PostgreSQL server, including host metrics. Information includes availability and connection status, storage and host information, and operations and performance metrics. The right side of the page features an expandable summary box that can display the Top 10 SQL executed in the current time range by one of several metrics or the Top 10 Alarms currently active for this server. In the action panel on the right pane, the PostgreSQL Agent Selector allows you to switch between PostgreSQL servers.
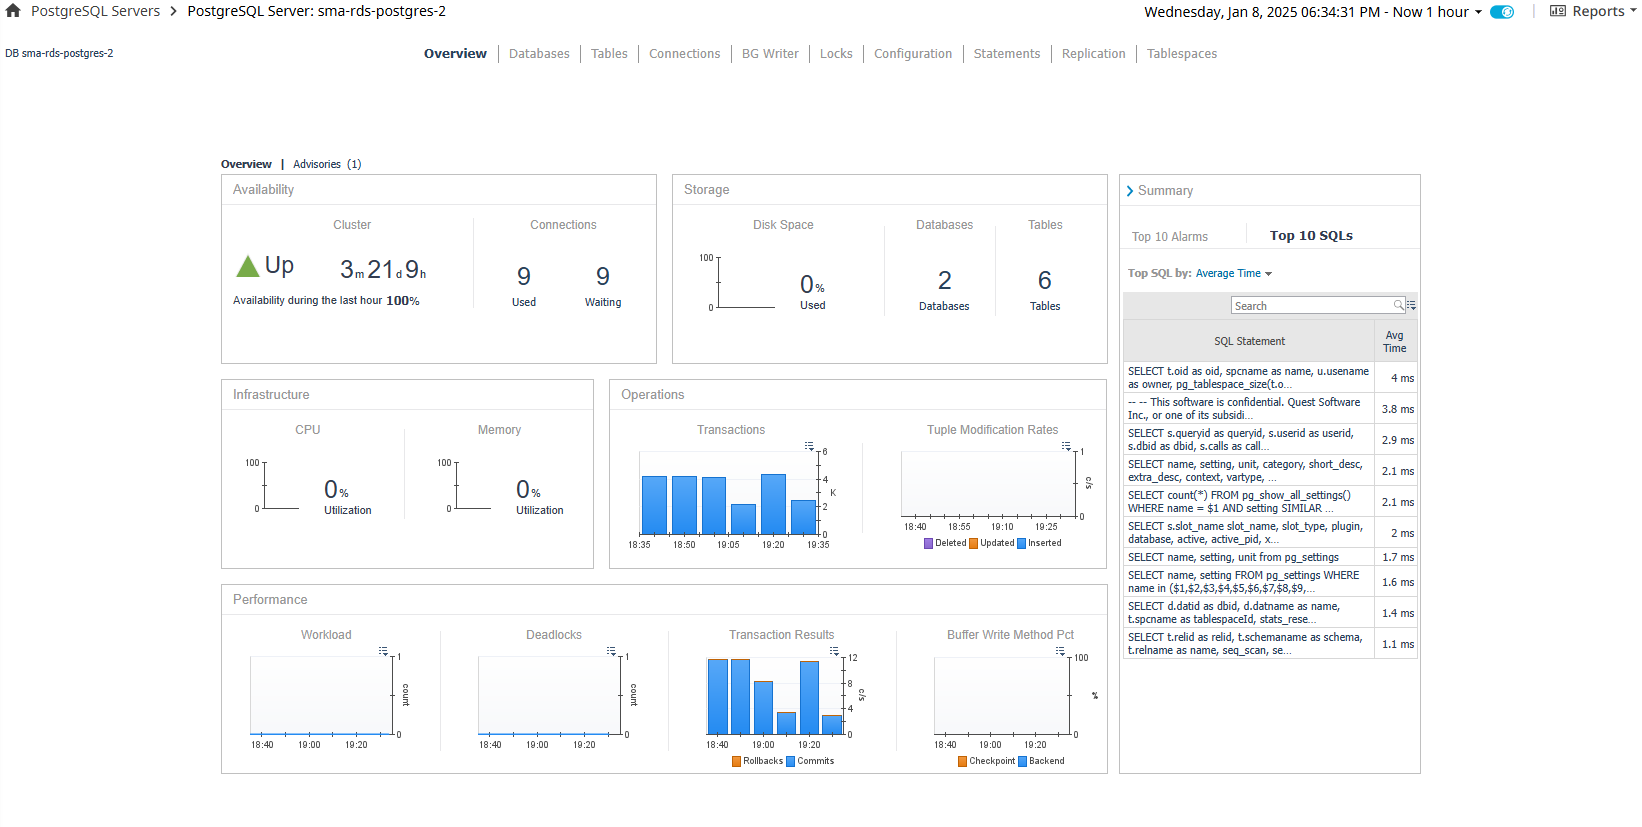
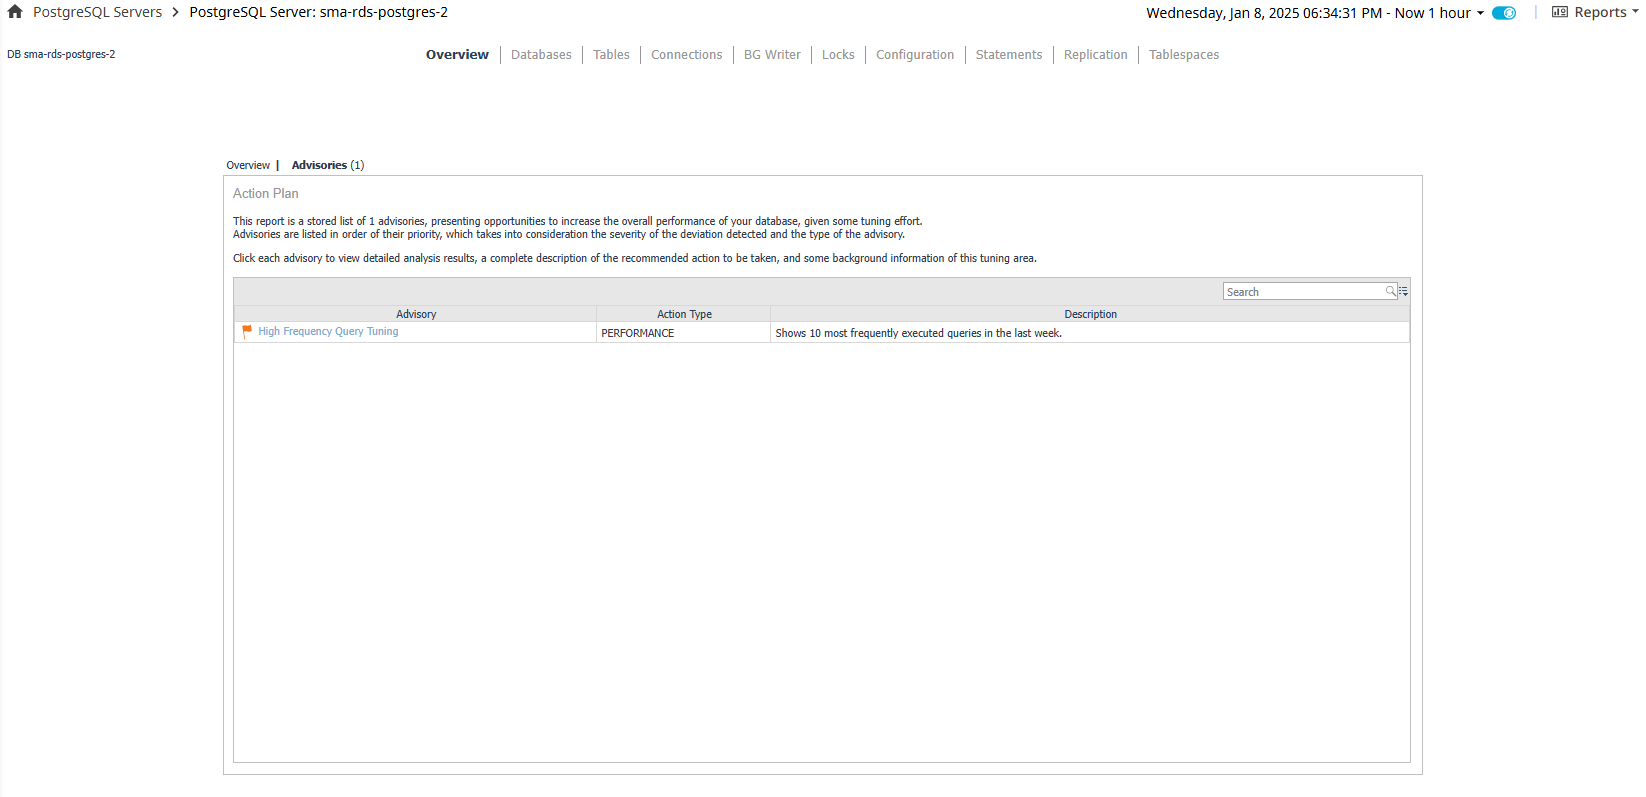
A link at the top left shows the number of active Advisories and allows switching between the Overview and Advisories pages. Clicking on any of the listed Advisories will launch a popup of the full Advisory, which contains information and advice on improving the performance, security, or other aspects of the monitored server.
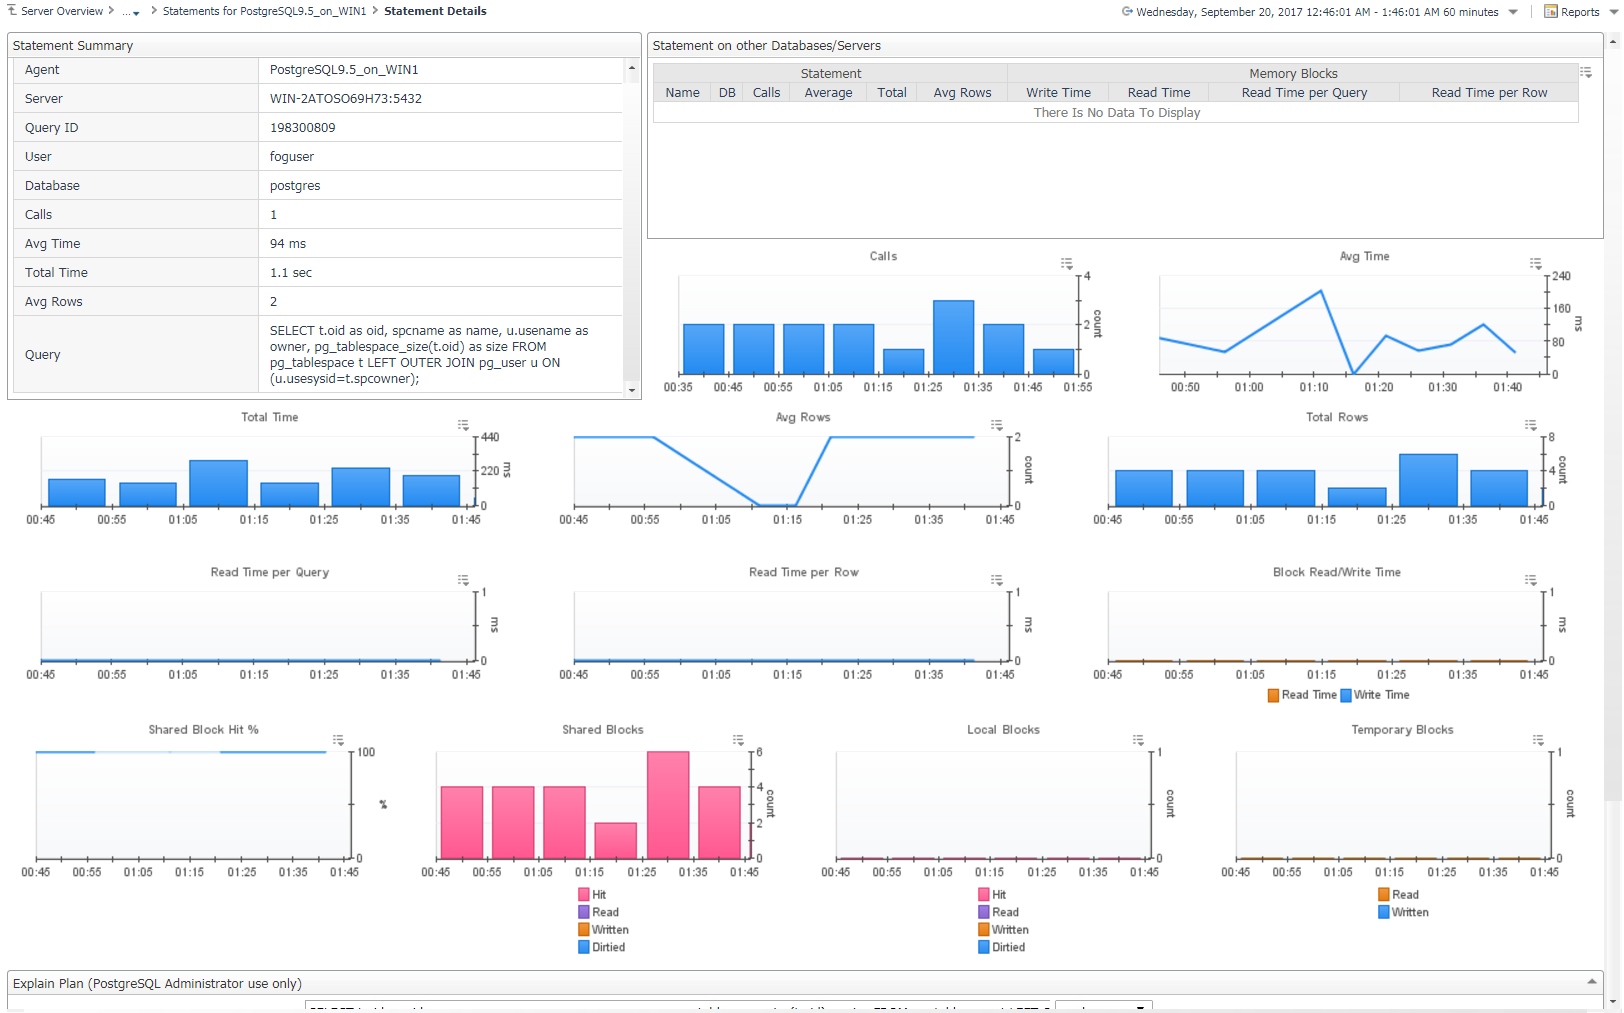
Statements Details
The Statement Details page provides a more in-depth look at the operations and history of a particular statement as well as its performance on other monitored servers, if the same queryid has been found. This page also features the Explain Plan Request form, which can be used to request an explain plan for the statement if it has been enabled in the agent properties and the Foglight user has the PostgreSQL Administrator role.
Data
- Statement Summary
- Agent – Agent monitoring the PostgreSQL Server.
- Server – The host:port of the PostgreSQL server.
- Query ID – An internally-generated hash calculation. For versions below 9.4, where queryid is not available from the server, a hash code has been generated by the agent based solely on a concatenation of the database name and query text
- User – Name of the first user that executed the statement.
- Database – Name of the database in which the statement was executed.
- Calls – Number of times the statement has been executed.
- Average Time – Average time spent executing the statement per call.
- Total Time – Total time spent executing statements.
- Avg Rows – Average number of rows retrieved or affected by the query.
- Query – Text of a representative statement (up to track_activity_query_size bytes). Statements with the same operations plan may have slight differences in the original text, but are represented by a single statement.
- Statements On Other Servers
- This table shows performance of the same query on other monitored PostgreSQL servers on which it may be performed, for comparison to the selected server.
In order to match the queries across servers, this table relies on the queryid which is not guaranteed to be the same across servers.
Per PostgreSQL documentation (https://www.postgresql.org/docs/current/static/pgstatstatements.html ):
“As a rule of thumb, queryid values can be assumed to be stable and comparable only so long as the underlying server version and catalog metadata details stay exactly the same. Two servers participating in replication based on physical WAL replay can be expected to have identical queryid values for the same query. However, logical replication schemes do not promise to keep replicas identical in all relevant details, so queryid will not be a useful identifier for accumulating costs across a set of logical replicas. If in doubt, direct testing is recommended.”
- Other Graphs
- Represent historical views of metrics listed on the Statements page table.
Actions
Statements On Other Servers Table
- Name (drilldown) – Switches the page to represent the same statement as performed on the selected server.
Explain Plan Request
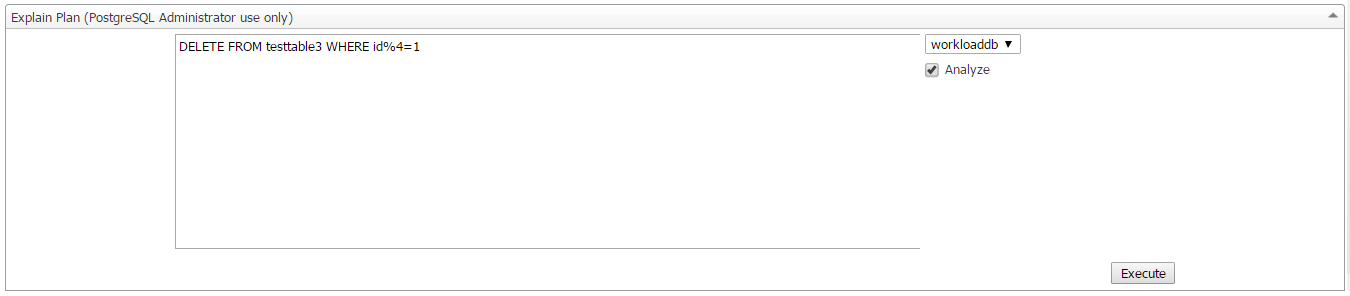
If Enable Explain Plans is set to true in the agent properties, this form allows a user with the PostgreSQL Administrator role to request explain plans. The text area field will be pre-filled with the normalized query text of the statement being investigated. It can (or must be) modified to an appropriate form for the PostgreSQL server to consider it a legitimate statement (? replaced with real numerical or string values). The database is also auto-selected, but may be switched.
If Enable Explain Analyze has been set to true in the agent properties, the Analyze option in this form will be selectable. If selected, the EXPLAIN ANALYZE command will carry out the command on the server and return actual run times and other statistics. Administrators should be very careful when using this option. If unset, the server will not actually run the query and will instead return an expected execution plan.
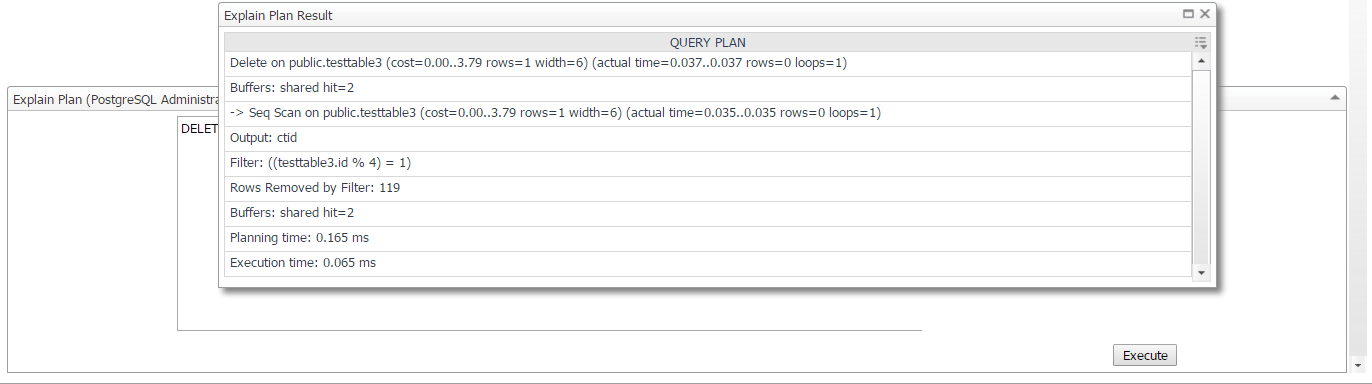
When done, click the Execute button to request the Explain plan and wait. After a short time, a popup should launch with the results of the explain plan request similar to the screenshot below. The Foglight user and statement performed will also be logged to the Agent Log.
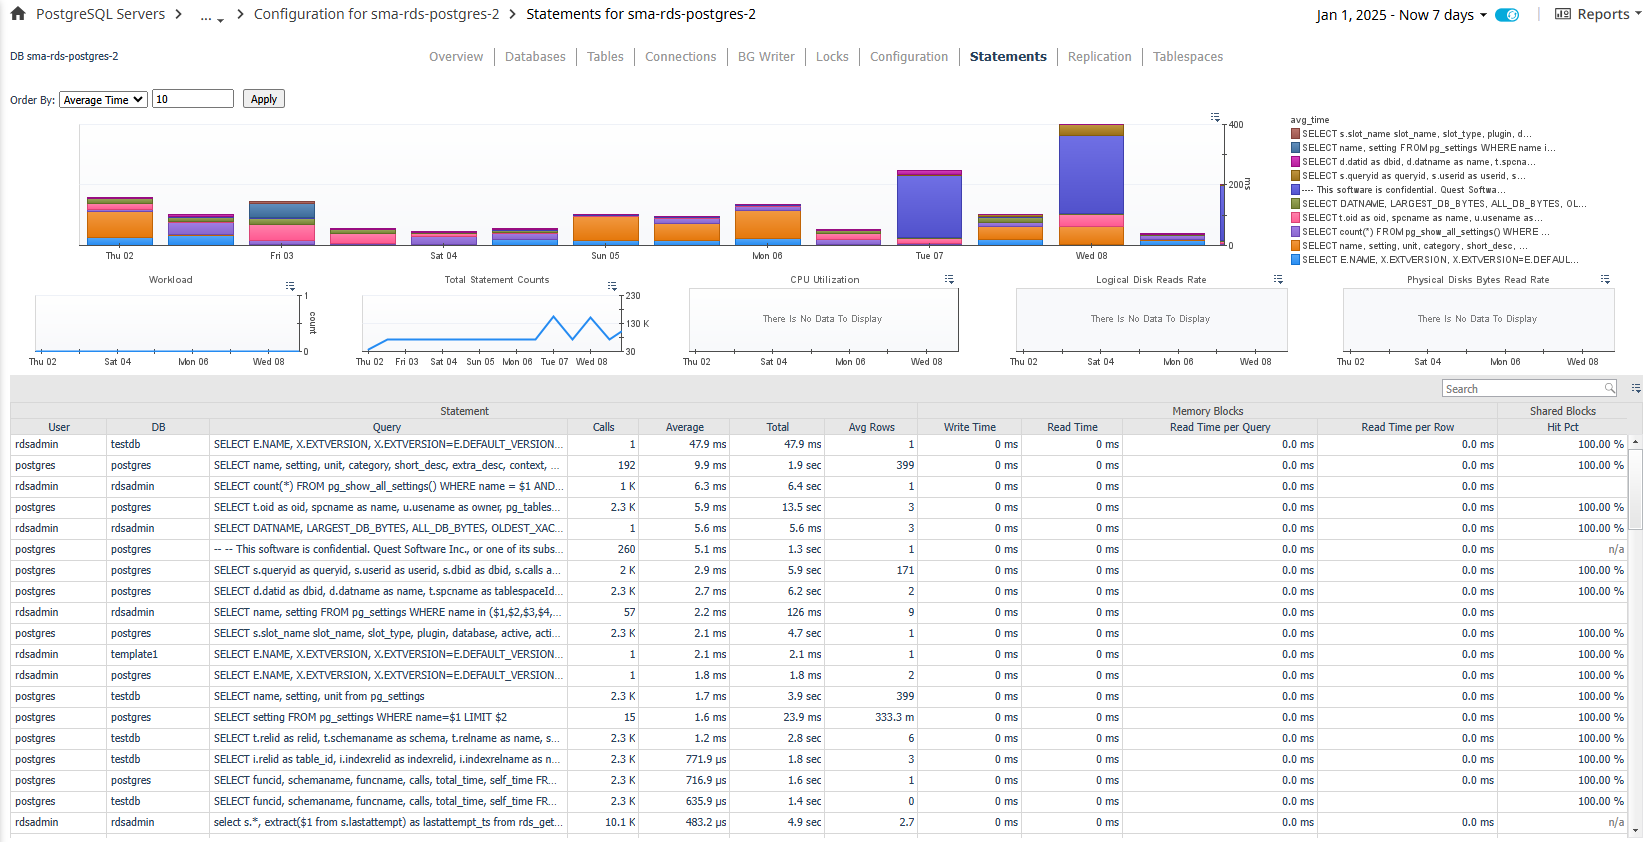
Statements
If Statement Tracking is enabled, the Statements dashboard shows a number of the top statements collected from the server, sorted and limited by fields specified in the Agent Properties. The bar graph can be customized using the fields above it to show top statements by several categories. The graphs below show workload, statement counts, and system utilization metrics (if host is being monitored), in order to allow the user to correlate potentially problematic statements with impact on the system. Below, a table lists all collected statements that have been called in the selected time period. Many of these fields are hidden by default for space considerations, but can be made visible by using the customizer at the top right of the table. A default search filter is set in the top-right section of the table to exclude calls made to system databases, usually internal processes or monitoring queries. This can be cleared or modified to show different results in the table. In the action panel on the right pane, the PostgreSQL Agent Selector allows you to switch between servers without leaving the page.
To enable statement tracking, refer to Statement Monitoring.
You can view PostgreSQL PI as an alternative to SQL statements in PostgreSQL. For more information, refer to Using PostgreSQL Performance Investigator (PI).
Data
Statements Table
- Statement
- User – Name of the user that executed the statement.
- User ID – ID of the user that executed the statement.
- DB – Name of the database in which the statement was executed.
- DB ID – ID of the database in which the statement was executed.
- Query – Text of a representative statement (up to track_activity_query_size bytes). Statements with the same operations plan may have slight differences in the original text, but are represented by a single statement.
- Calls – Number of times the statement has been executed.
- Rows - Total number of rows retrieved or affected by the query.
- Average – Average time spent executing the statement per call.
- Total – Total time spent executing statements.
- Memory Blocks
- Write Time - Total time the statement spent writing blocks (if track_io_timing is enabled, otherwise zero).
- Read Time - Total time the statement spent reading blocks (if track_io_timing is enabled, otherwise zero).
- Read Time per Query - Time the statement spent reading blocks per query.
- Read Time per Query - Time the statement spent reading blocks per row retrieved/affected.
- Shared Blocks
- Hit Pct – Percentage of shared block cache hits of total blocks read.
- Read – Number of shared blocks read.
- Hit – Number of shared block cache hits.
- Written – Number of shared blocks written.
- Dirtied – Number of shared blocks dirtied.
- Local Blocks
- Read – Number of local blocks read.
- Hit – Number of local block cache hits.
- Written – Number of local blocks written.
- Dirtied – Number of local blocks dirtied.
- Temp Blocks
- Read – Number of temp blocks read.
- Written – Number of temp blocks written.
Actions
Statements Graph
- Bar Section (dwell) – Popup of selected statement details.
- Bar Section (drilldown) – Navigates to the Statement Details page.
Statements Table
- DB (drilldown) – Navigates to the Databases dashboard with DB selected.
- Query (drilldown) - Shows the full query text in a formatted, colored state for better readability.
- Other metrics (drilldown or dwell) – Shows a popup time plot for the selected metric.
You can click on the required statement to view its details on the Statement Details dashboard.
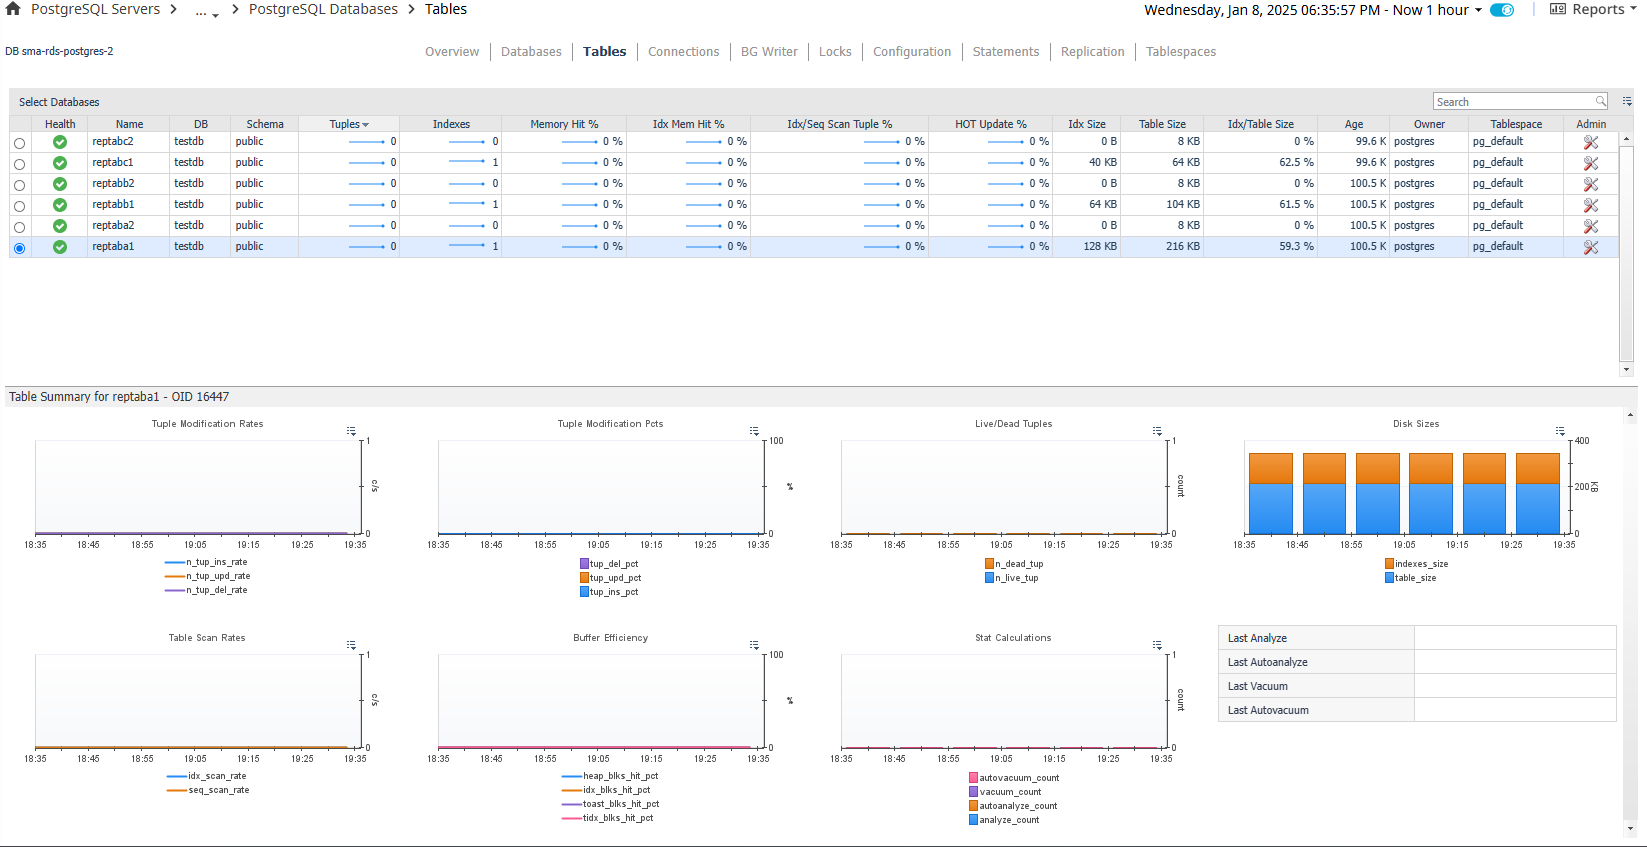
Tables
The Tables page contains 2 sections separated by a horizontal splitter: the top section, which displays a row for each table as well as some key information, and the bottom section, which displays metric information related to the table selected in the top section. The size of the two sections can be increased or decreased by dragging the horizontal splitter bar up or down. In the action panel on the right pane, the DB Selector allows you to switch between databases or show tables from all databases.
Data
Top Section – Tables Table
- Health – Shows the overall health of the table.
- Name – The name of the table.
- DB – The database that contains the table.
- Schema – The schema that contains the table.
- Tuples – The number of tuples in the table.
- Indexes – The number of indexes in the table.
- Memory Hit % - Percentage where a read from the table or any related resource is successfully sourced from buffer cache rather than needing physical disk I/O.
- Idx Mem Hit % – Percentage where a read from the table indexes is successfully sourced from buffer cache rather than needing physical disk I/O.
- Idx/Seq Scan Tuple % – Percentage of tuples returned from index vs. sequential scans.
- HOT Update % – Percentage of rows updated by HOT.
- Idx Size – Disk size of all index tables associated with the table**.**
- Table Size – Disk size of the table.
- Idx/Table Size – Ratio of index size to table size.
- Owner – Owner of the table.
- Tablespace – Tablespace where table data is stored.
Bottom Section – Table Metrics
- Tuple Modifications Rates – Rate of tuples modified by deletion, update, or insert operations.
- Tuple Modification Pcts – Distribution of modification operations affecting table tuples.
- Live/Dead Tuples – Counts of live and dead tuples in table memory. Dead tuples are deleted rows that have not yet been cleaned up.
- Disk Sizes – Disk sizes of table, table indexes, and total table size, including related resources.
- Table Scan Rates – Rates of index and sequential scans on this table.
- Buffer Efficiency – Breakdown of memory block hits by table resource.
- Stat Calculations – Counts of vacuum and analyze operations.
- Last…Operation – Timestamp of last operation on the table.
Actions
Table Table
- Health (dwell or drilldown) - Shows a breakdown of child objects in a warning, critical, or fatal state.
- DB (drilldown) – Navigates to the Database page for the selected table.
- Tuples (dwell) – A popup time plot of the tuple count.
- Indexes
- Dwell – A popup time plot of the index count.
- Drilldown – Navigates to the indexes page.
- Memory Hit % (dwell or drilldown) - A popup time plot of the memory hit percentage.
- Idx Mem Hit % (dwell or drilldown) - A popup time plot of the index memory hit percentage.
- Idx/Seq Scan Tuple % (dwell or drilldown) - A popup time plot of the index/sequential scan tuple percent.
- HOT Update % (dwell or drilldown) - A popup time plot of the HOT update percent.
- Idx Size (dwell or drilldown) - A popup time plot of the index size.
- Table Size (dwell or drilldown) - A popup time plot of the table size.
- Idx/Table Size (dwell or drilldown) - A popup time plot of the index/table size.
- Tablespace
- Dwell - A popup table with the tablespace’s health, OI, owner, and disk size.
- Drilldown – Navigates to the Tablespaces page.
Admin Actions
If your user account has the PostgreSQL Administrator role and the PostgreSQL user provided to the agent has the appropriate permissions, you can perform administrative actions on the server from the dashboard. Click the icon in the Admin table column to perform one of the following actions:
- Vacuum + Analyze – Perform a VACUUM ANALYZE operation on the table.
- Vacuum – Perform a VACUUM operation on the table.
- Analyze – Perform an ANALYZE operation on the table.
- Stat Reset – Reset the statistic counts on the table.
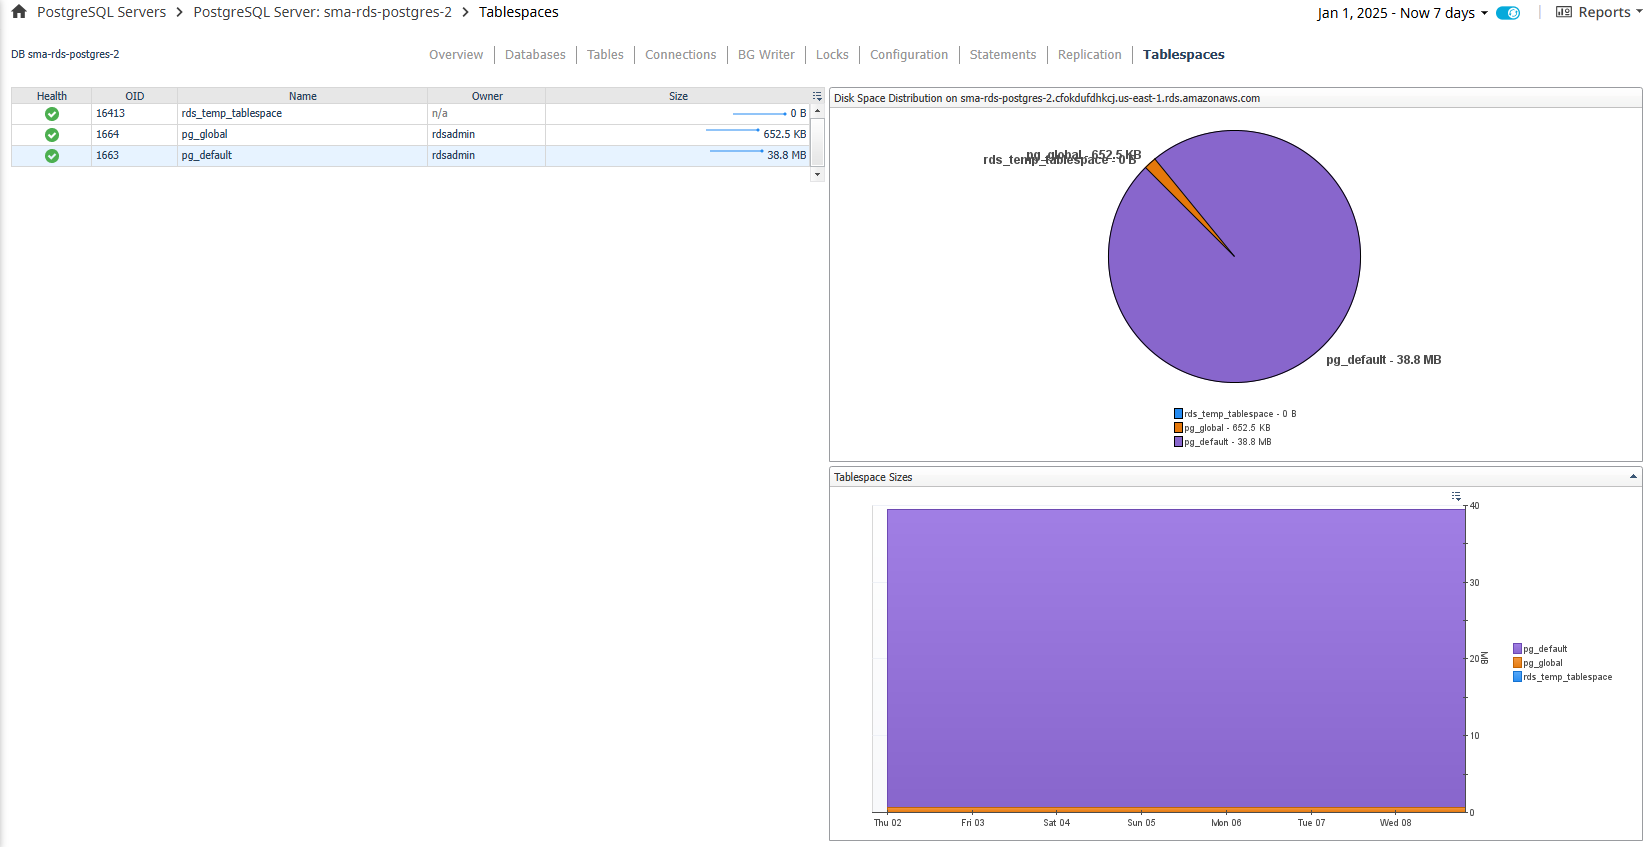
Tablespaces
The Tablespaces page shows tablespaces used by the selected PostgreSQL server. The table on the left displays a row for each tablespace while the graphs on the right show a visual distribution of disk spaze. In the action panel on the right pane, the PostgreSQL Agent Selector allows you to switch between PostgreSQL servers.
Data
Table
- Health – Shows the overall health of the tablespace.
- OID – OID of the tablespace.
- Name – Name of the tablespace.
- Owner – Owner of the tablespace.
- Size – Disk size of the tablespace.
Graphs
- Disk Space Distribution – Shows the distribution of disk space on the host between tablespaces, other used space, and free space. If host storage information is not being collected, only tablespace sizes are shown.
- Tablespace Sizes – Compares tablespace sizes to each other and shows combined total space used.
Actions
- Health (dwell or drilldown) - Shows a breakdown of child objects in a warning, critical, or fatal state.
- Size (dwell) – A popup time plot of the disk size.