Account Overview
This dashboard displays the following components:
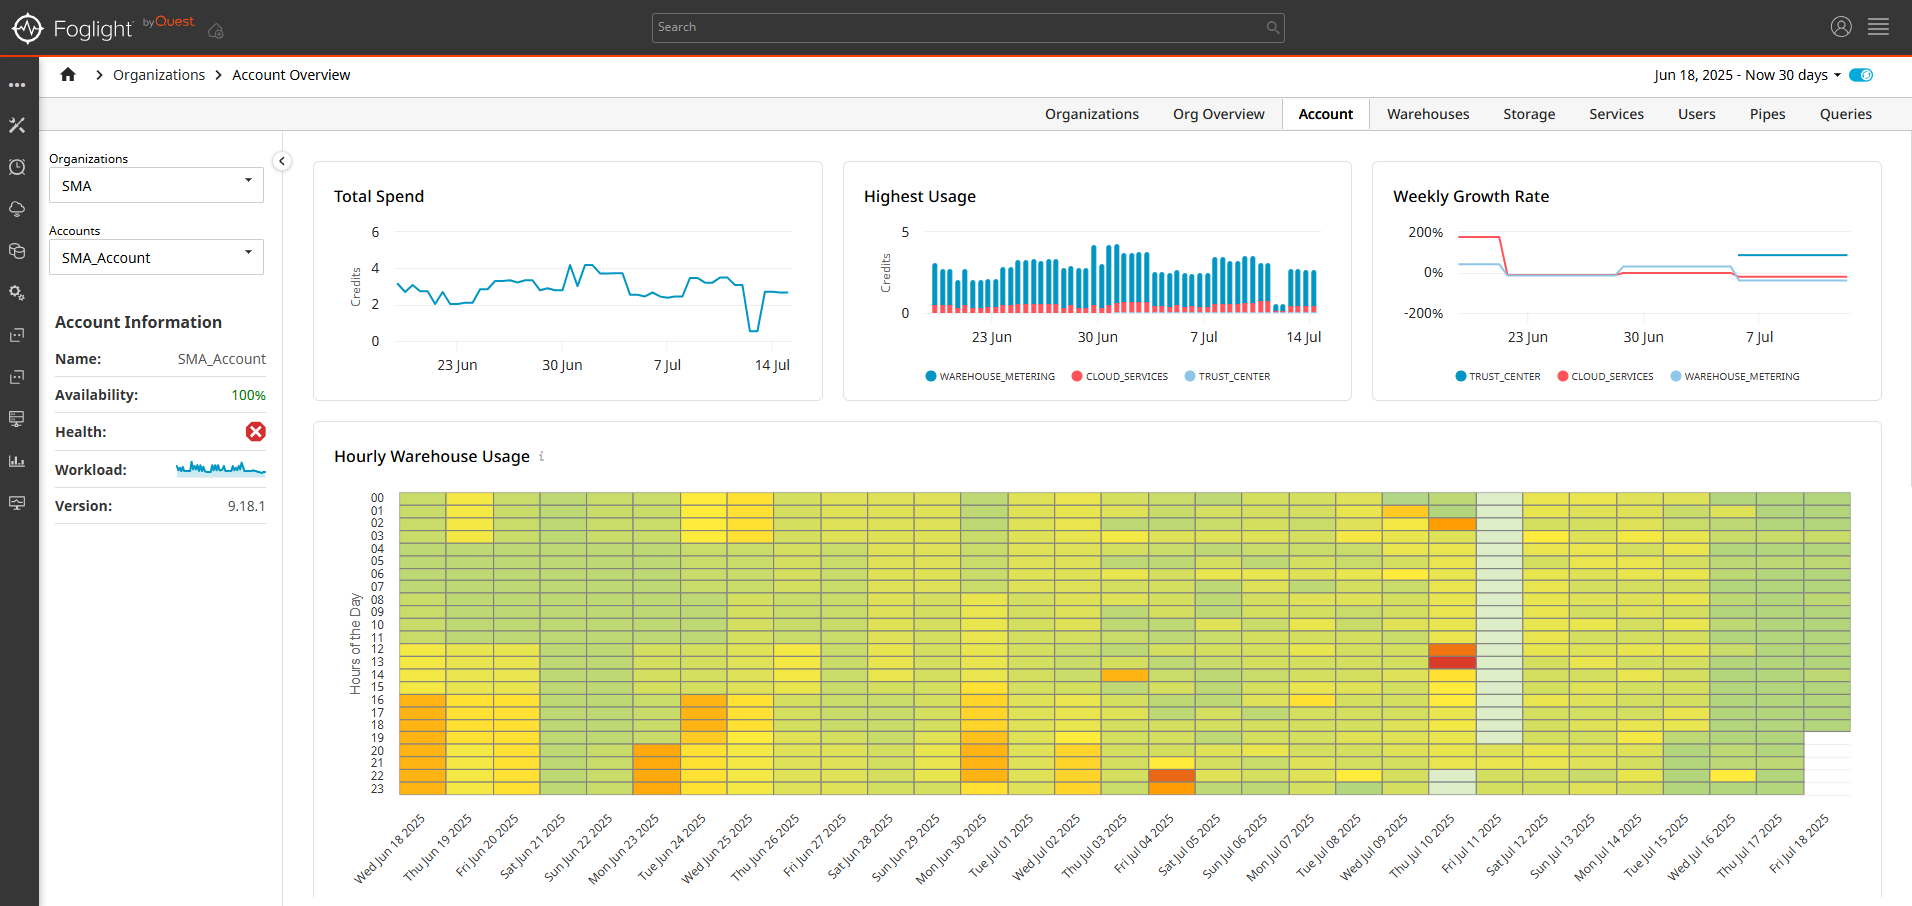
Total Spend chart: The total spending for the account.
Highest Usage chart: Displays the top five Snowflake services by usage.
Growth Rate: The weekly account growth rate.
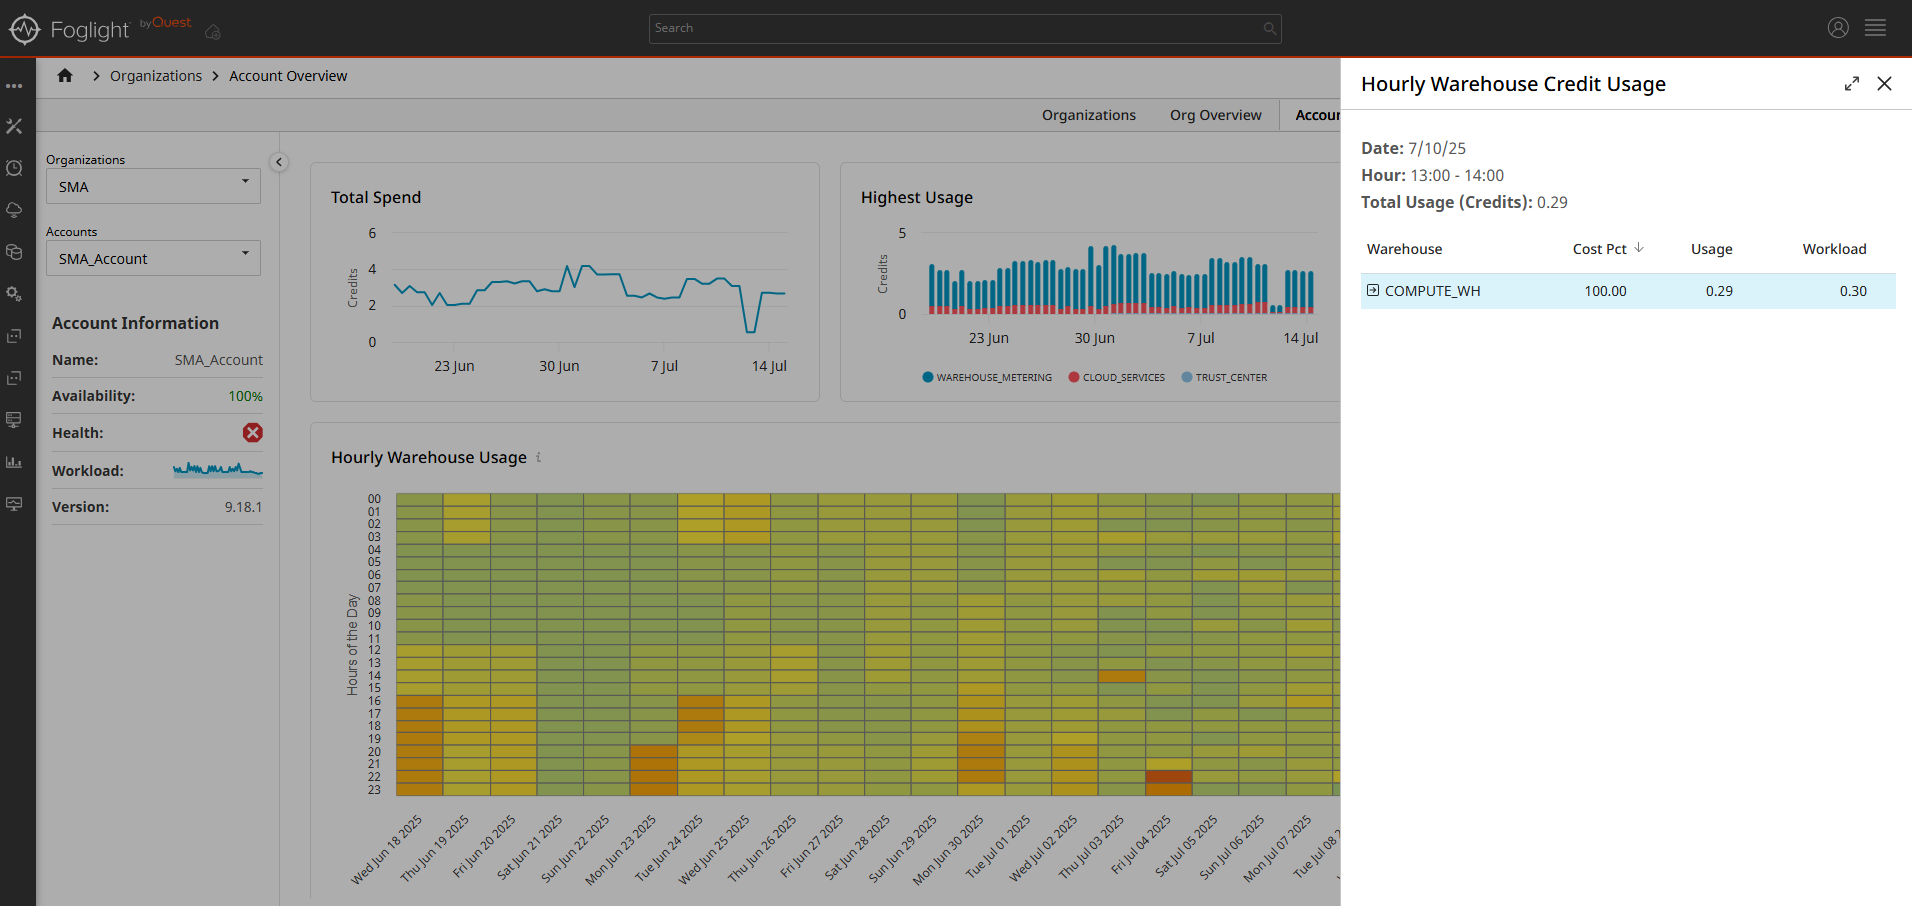
Hourly Warehouse Credit Usage Heatmap: Displays a heatmap of hourly warehouse credit usage for the last seven days. Selecting a cell in the heatmap opens a drawer showing credit usage by warehouse for the selected hour. Selecting a warehouse redirects the user to the Queries dashboard, filtered by the selected hour and warehouse to show only the queries that ran during that time.
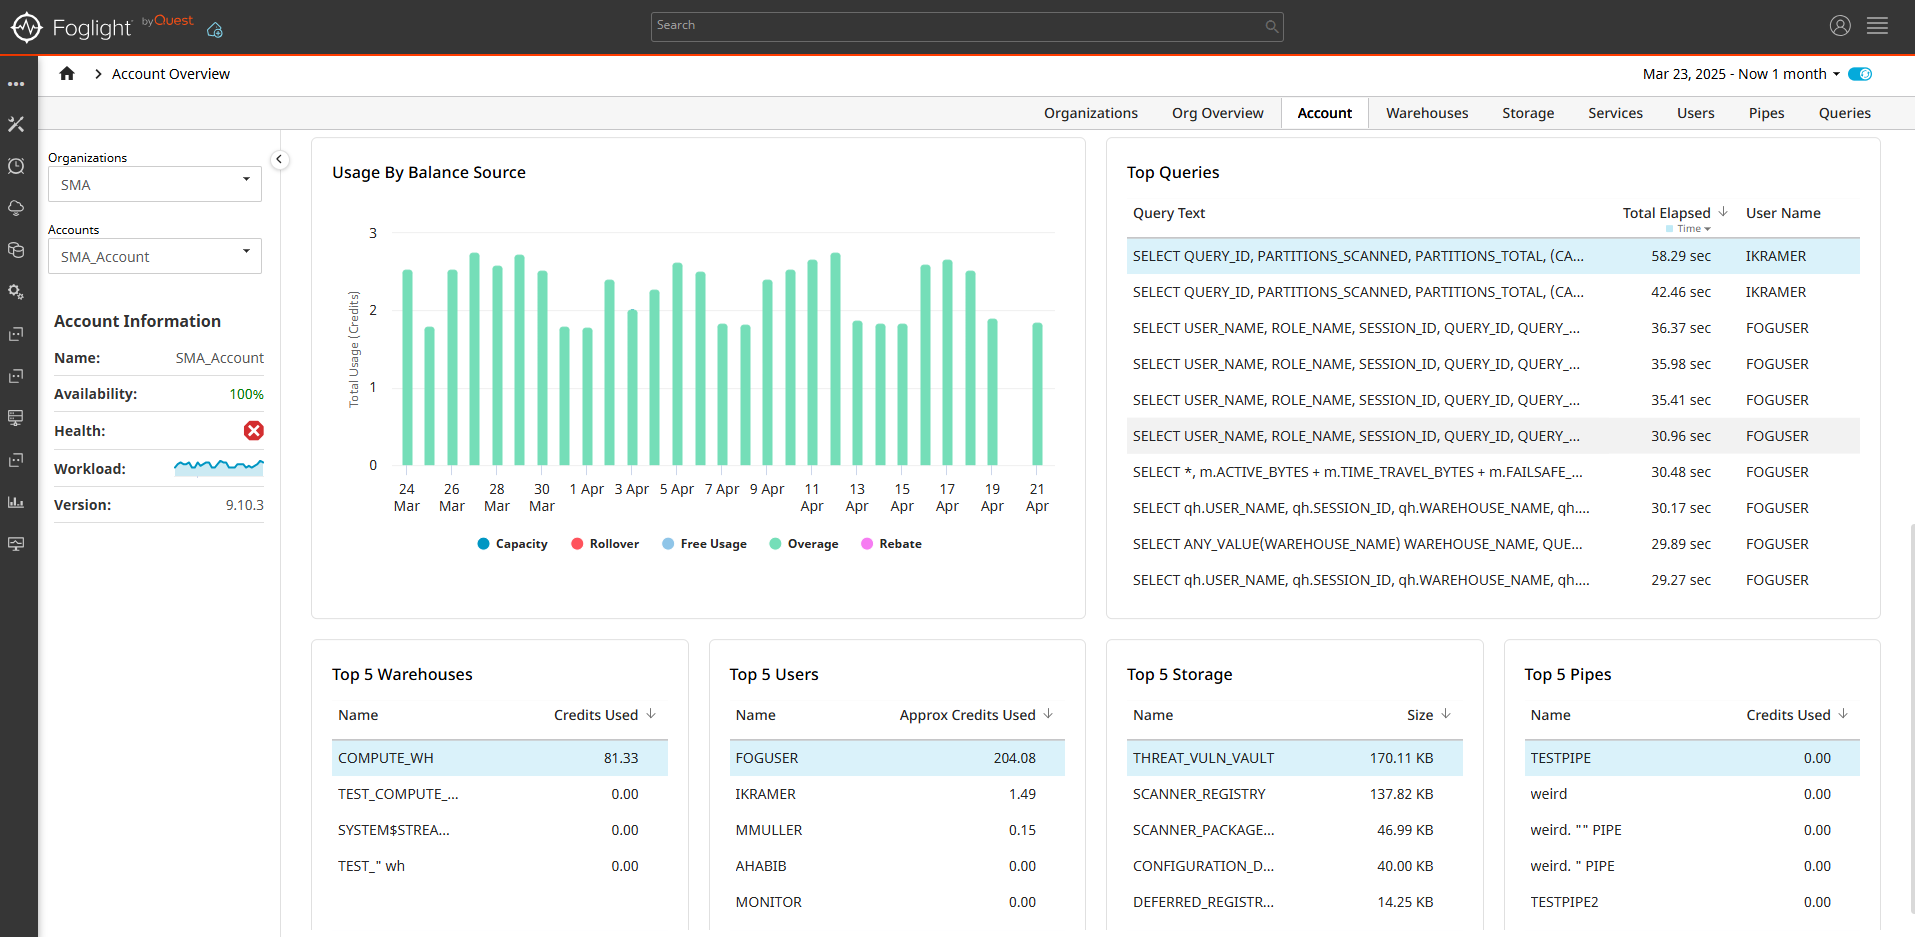
Usage By Balance Source Chart: Bar chart displaying usage by balance source for the account.
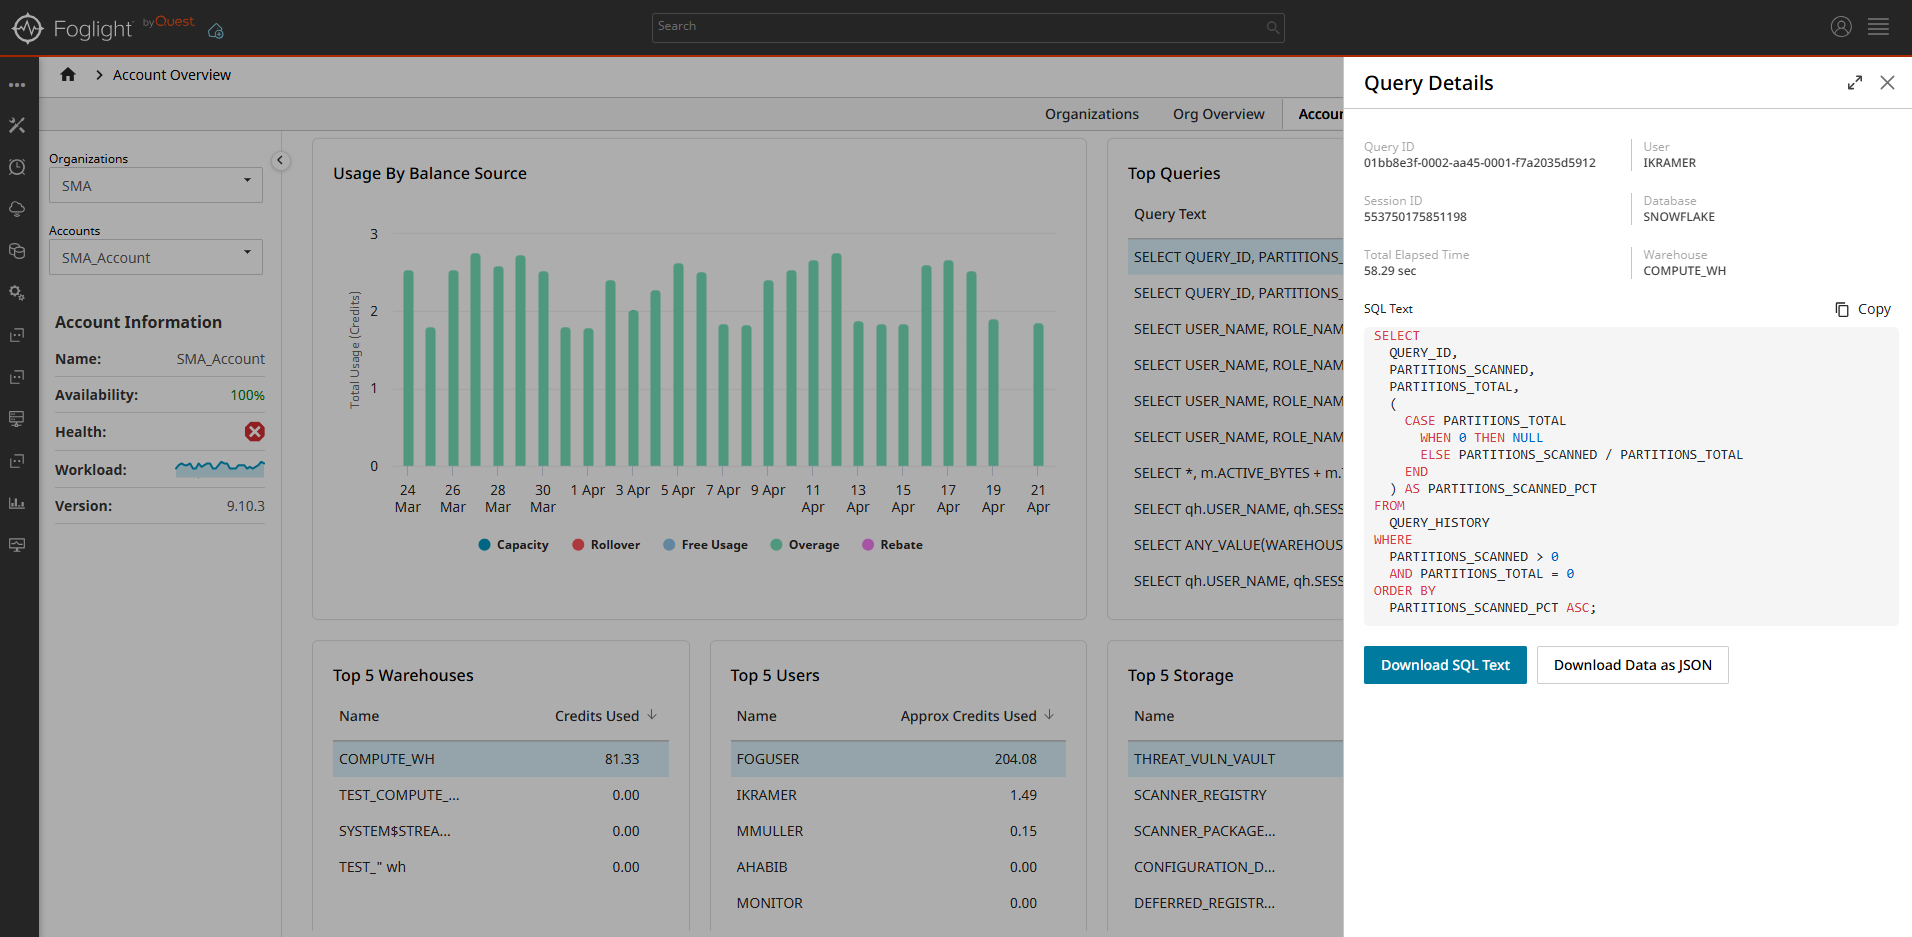
Top Ten Queries: Displays the top ten queries by total elapsed time. Selecting a Query will display a Drawer with the Query details and formatted SQL Text.
Top 5 Tables:
- Top five Warehouses by credit usage.
- Top five Users by approximate credits used.
- Top five pipes by credits used.
- Top five tables with most storage used.